
Page 404 - Fundamentals of Radar Signal Processing
P. 404
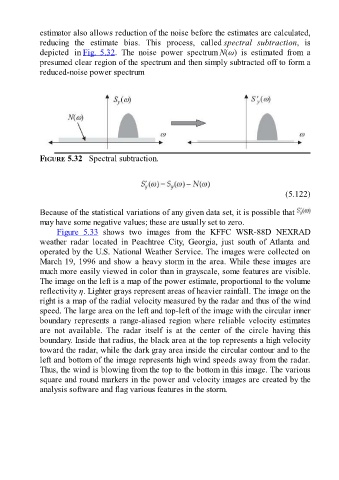
estimator also allows reduction of the noise before the estimates are calculated,

               reducing  the  estimate  bias.  This  process,  called spectral  subtraction,  is
               depicted  in Fig.  5.32.  The  noise  power  spectrum N(ω)  is  estimated  from  a
               presumed clear region of the spectrum and then simply subtracted off to form a
               reduced-noise power spectrum


               FIGURE 5.32   Spectral subtraction.


                                                                                                     (5.122)

               Because of the statistical variations of any given data set, it is possible that
               may have some negative values; these are usually set to zero.
                     Figure  5.33  shows  two  images  from  the  KFFC  WSR-88D  NEXRAD
               weather  radar  located  in  Peachtree  City,  Georgia,  just  south  of  Atlanta  and
               operated by the U.S. National Weather Service. The images were collected on

               March 19, 1996 and show a heavy storm in the area. While these images are
               much more easily viewed in color than in grayscale, some features are visible.
               The image on the left is a map of the power estimate, proportional to the volume
               reflectivity η. Lighter grays represent areas of heavier rainfall. The image on the
               right is a map of the radial velocity measured by the radar and thus of the wind
               speed. The large area on the left and top-left of the image with the circular inner

               boundary  represents  a  range-aliased  region  where  reliable  velocity  estimates
               are  not  available.  The  radar  itself  is  at  the  center  of  the  circle  having  this
               boundary. Inside that radius, the black area at the top represents a high velocity
               toward the radar, while the dark gray area inside the circular contour and to the
               left and bottom of the image represents high wind speeds away from the radar.
               Thus, the wind is blowing from the top to the bottom in this image. The various
               square and round markers in the power and velocity images are created by the

               analysis software and flag various features in the storm.