
Page 60 - Fundamentals of Radar Signal Processing
P. 60
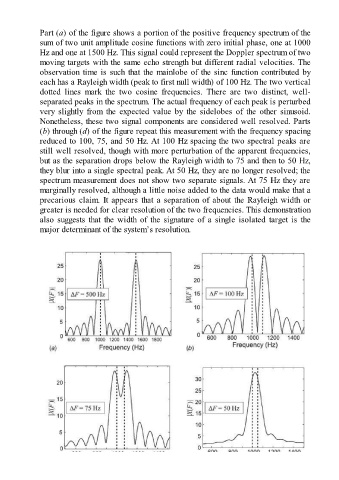
Part (a) of the figure shows a portion of the positive frequency spectrum of the

               sum of two unit amplitude cosine functions with zero initial phase, one at 1000
               Hz and one at 1500 Hz. This signal could represent the Doppler spectrum of two
               moving targets with the same echo strength but different radial velocities. The
               observation time is such that the mainlobe of the sinc function contributed by
               each has a Rayleigh width (peak to first null width) of 100 Hz. The two vertical
               dotted  lines  mark  the  two  cosine  frequencies.  There  are  two  distinct,  well-

               separated peaks in the spectrum. The actual frequency of each peak is perturbed
               very  slightly  from  the  expected  value  by  the  sidelobes  of  the  other  sinusoid.
               Nonetheless, these two signal components are considered well resolved. Parts
               (b) through (d) of the figure repeat this measurement with the frequency spacing
               reduced to 100, 75, and 50 Hz. At 100 Hz spacing the two spectral peaks are
               still well resolved, though with more perturbation of the apparent frequencies,
               but as the separation drops below the Rayleigh width to 75 and then to 50 Hz,

               they blur into a single spectral peak. At 50 Hz, they are no longer resolved; the
               spectrum measurement does not show two separate signals. At 75 Hz they are
               marginally resolved, although a little noise added to the data would make that a
               precarious claim. It appears that a separation of about the Rayleigh width or
               greater is needed for clear resolution of the two frequencies. This demonstration
               also  suggests  that  the  width  of  the  signature  of  a  single  isolated  target  is  the

               major determinant of the system’s resolution.