
Page 277 - Fundamentals of Reservoir Engineering
P. 277
OILWELL TESTING 214
2) If the test is analysed assuming transient flow conditions, the evaluation would be as
set out in table 7.14.
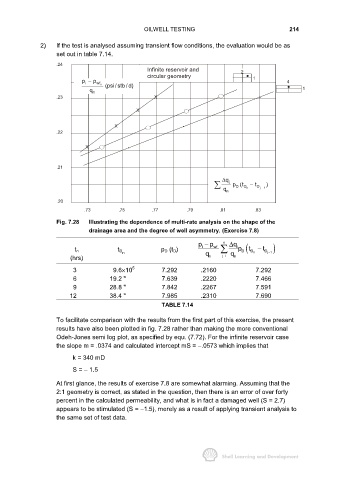
.24
Infinite reservoir and 2
circular geometry
p i − p wf n 1 4
q n (psi/stb /d) 1
.23 X
X
X
.22
X
.21
∆ q j
p(t D − t )
D
q n n j D − 1
.20
.73 .75 .77 .79 .81 .83
Fig. 7.28 Illustrating the dependence of multi-rate analysis on the shape of the
drainage area and the degree of well asymmetry. (Exercise 7.8)
p − p wf n ∆ q i
t
i
t n t D p D (t D) p D ( D − t D )
n q ji q n j 1
−
(hrs) n = n
3 9.6×10 5 7.292 .2160 7.292
6 19.2 " 7.639 .2220 7.466
9 28.8 " 7.842 .2267 7.591
12 38.4 " 7.985 .2310 7.690
TABLE 7.14
To facilitate comparison with the results from the first part of this exercise, the present
results have also been plotted in fig. 7.28 rather than making the more conventional
Odeh-Jones semi log plot, as specified by equ. (7.72). For the infinite reservoir case
the slope m = .0374 and calculated intercept mS = −.0573 which implies that
k = 340 mD
S = − 1.5
At first glance, the results of exercise 7.8 are somewhat alarming. Assuming that the
2:1 geometry is correct, as stated in the question, then there is an error of over forty
percent in the calculated permeability, and what is in fact a damaged well (S = 2.7)
appears to be stimulated (S = −1.5), merely as a result of applying transient analysis to
the same set of test data.