Page 281 - Fundamentals of Reservoir Engineering
P. 281

OILWELL TESTING                                    218

                     does not necessarily mean that flow should be under semi-steady state conditions at
                     this final rate. The condition is usually satisfied since the reliable analysis of a multi-
                     rate test, as already noted, requires that the total test duration should be brief so that
                     transient analysis can be applied.

                     As a demonstration of the effectiveness of this analysis technique, a test has been
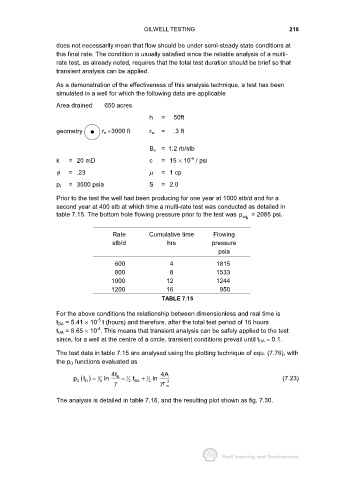
                     simulated in a well for which the following data are applicable
                     Area drained     650 acres

                                                     h    =   50ft

                     geometry        r e ≈3000 ft    r w  =   .3  ft


                                                     B o = 1.2 rb/stb
                                                                    -6
                     k   = 20 mD                     c    = 15 × 10  / psi
                     φ   =.23                        µ    =1 cp

                     p i  = 3500 psia                S    = 2.0

                     Prior to the test the well had been producing for one year at 1000 stb/d and for a
                     second year at 400 stb at which time a multi-rate test was conducted as detailed in
                     table 7.15. The bottom hole flowing pressure prior to the test was p wf N  = 2085 psi.


                                         Rate        Cumulative time        Flowing
                                        stb/d               hrs            pressure
                                                                              psia

                                         600                 4               1815
                                         800                 8               1533
                                        1000               12                1244
                                        1200               16                 950
                                                          TABLE 7.15

                     For the above conditions the relationship between dimensionless and real time is
                                   -5
                     t DA = 5.41 × 10  t (hours) and therefore, after the total test period of 16 hours
                                   -4
                     t DA = 8.65 × 10 . This means that transient analysis can be safely applied to the test
                     since, for a well at the centre of a circle, transient conditions prevail until t DA ≈ 0.1.

                     The test data in table 7.15 are analysed using the plotting technique of equ. (7.76), with
                     the p D functions evaluated as

                                        4t               4A
                           p D  () =  1 2  ln  D  =  1 2  t DA  +  1 2  ln                          (7.23)
                              t
                               D
                                         γ                r γ  w 2
                     The analysis is detailed in table 7.16, and the resulting plot shown as fig. 7.30.
   276   277   278   279   280   281   282   283   284   285   286