
Page 286 - Fundamentals of Reservoir Engineering
P. 286
OILWELL TESTING 223
AMERADA WITHIN
LUBRICATOR
GATE VALVE
MASTER VALVE
CASING WIRELINE WINCH
TUBING
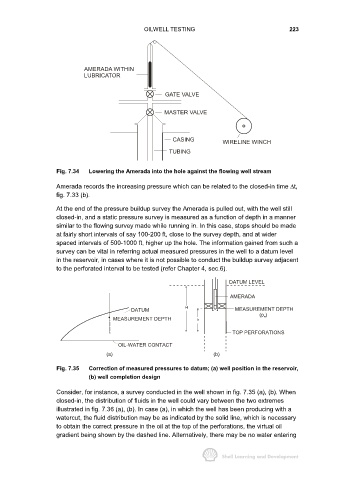
Fig. 7.34 Lowering the Amerada into the hole against the flowing well stream
Amerada records the increasing pressure which can be related to the closed-in time ∆t,
fig. 7.33 (b).
At the end of the pressure buildup survey the Amerada is pulled out, with the well still
closed-in, and a static pressure survey is measured as a function of depth in a manner
similar to the flowing survey made while running in. In this case, stops should be made
at fairly short intervals of say 100-200 ft, close to the survey depth, and at wider
spaced intervals of 500-1000 ft, higher up the hole. The information gained from such a
survey can be vital in referring actual measured pressures in the well to a datum level
in the reservoir, in cases where it is not possible to conduct the buildup survey adjacent
to the perforated interval to be tested (refer Chapter 4, sec.6).
DATUM LEVEL
AMERADA
H
DATUM MEASUREMENT DEPTH
(p )
m
MEASUREMENT DEPTH h
TOP PERFORATIONS
OIL-WATER CONTACT
(a) (b)
Fig. 7.35 Correction of measured pressures to datum; (a) well position in the reservoir,
(b) well completion design
Consider, for instance, a survey conducted in the well shown in fig. 7.35 (a), (b). When
closed-in, the distribution of fluids in the well could vary between the two extremes
illustrated in fig. 7.36 (a), (b). In case (a), in which the well has been producing with a
watercut, the fluid distribution may be as indicated by the solid line, which is necessary
to obtain the correct pressure in the oil at the top of the perforations, the virtual oil
gradient being shown by the dashed line. Alternatively, there may be no water entering