Page 296 - Fundamentals of Reservoir Engineering
P. 296

OILWELL TESTING                                    232


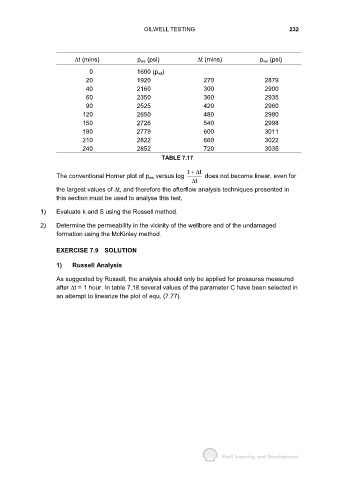
                           ∆t (mins)             p ws (psi)           ∆t (mins)             p ws (psi)

                                0                1600 (p wf)
                               20                1920                   270                   2879
                               40                2160                   300                   2900
                               60                2350                   360                   2935
                               90                2525                   420                   2960
                              120                2650                   480                   2980
                              150                2726                   540                   2998
                              180                2779                   600                   3011
                              210                2822                   660                   3022
                              240                2852                   720                   3035
                                                          TABLE 7.17

                                                                   t +∆ t
                     The conventional Horner plot of p ws versus log     does not become linear, even for
                                                                      t ∆
                     the largest values of ∆t, and therefore the afterflow analysis techniques presented in
                     this section must be used to analyse this test.

               1)    Evaluate k and S using the Russell method.

               2)    Determine the permeability in the vicinity of the wellbore and of the undamaged
                     formation using the McKinley method.


                     EXERCISE 7.9 SOLUTION

                     1)   Russell Analysis

                     As suggested by Russell, the analysis should only be applied for pressures measured
                     after ∆t = 1 hour. In table 7.18 several values of the parameter C have been selected in
                     an attempt to linearize the plot of equ. (7.77).
   291   292   293   294   295   296   297   298   299   300   301