
Page 297 - Fundamentals of Reservoir Engineering
P. 297
OILWELL TESTING 233
∆ p/(1 1/ C t)
∆
−
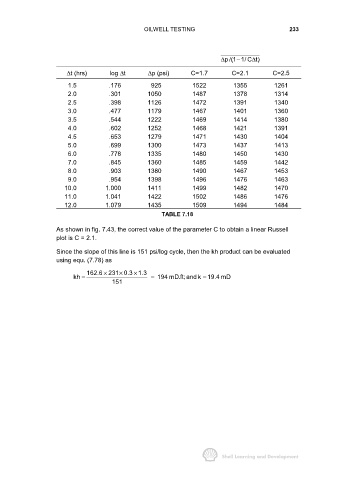
∆t (hrs) log ∆t ∆p (psi) C=1.7 C=2.1 C=2.5
1.5 .176 925 1522 1355 1261
2.0 .301 1050 1487 1378 1314
2.5 .398 1126 1472 1391 1340
3.0 .477 1179 1467 1401 1360
3.5 .544 1222 1469 1414 1380
4.0 .602 1252 1468 1421 1391
4.5 .653 1279 1471 1430 1404
5.0 .699 1300 1473 1437 1413
6.0 .778 1335 1480 1450 1430
7.0 .845 1360 1485 1459 1442
8.0 .903 1380 1490 1467 1453
9.0 .954 1398 1496 1476 1463
10.0 1.000 1411 1499 1482 1470
11.0 1.041 1422 1502 1486 1476
12.0 1.079 1435 1509 1494 1484
TABLE 7.18
As shown in fig. 7.43, the correct value of the parameter C to obtain a linear Russell
plot is C = 2.1.
Since the slope of this line is 151 psi/log cycle, then the kh product can be evaluated
using equ. (7.78) as
162.6 231 0.3 1.3
×
×
×
kh = = 194 mD.ft; and k = 19.4 mD
151