Page 294 - Fundamentals of Reservoir Engineering
P. 294

OILWELL TESTING                                    230

                                    1000


                                                                                McKinley type
                                                                                (curve (T/F = 5000)
                                     100
                                                                         X  match point
                               ∆t
                             (mins)                                         ∆  p = 800 psi
                                                         buildup plot  X
                                                                     X
                                                                   X
                                      10                         X  X
                                                               X
                                                             X               ∆  p F
                                                          X                       = .05
                                                                              q
                                       1
                                                    10 -4        10 -3       10 -2
                                                                  ∆  p F
                                                                    q

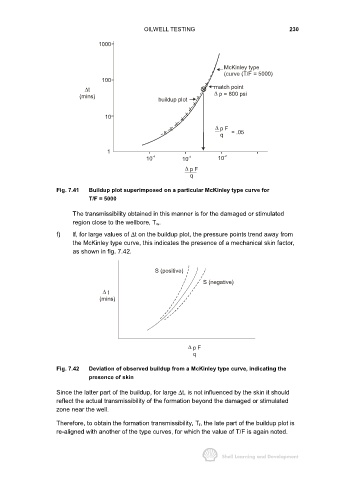
                     Fig. 7.41  Buildup plot superimposed on a particular McKinley type curve for
                                T/F = 5000

                           The transmissibility obtained in this manner is for the damaged or stimulated
                           region close to the wellbore, T w.

                     f)   If, for large values of ∆t on the buildup plot, the pressure points trend away from
                           the McKinley type curve, this indicates the presence of a mechanical skin factor,
                           as shown in fig. 7.42.


                                                       S (positive)
                                                                        S (negative)

                                     ∆  t
                                    (mins)


                                                                   ∆  p F
                                                                     q

                     Fig. 7.42  Deviation of observed buildup from a McKinley type curve, indicating the
                                presence of skin

                     Since the latter part of the buildup, for large ∆t, is not influenced by the skin it should
                     reflect the actual transmissibility of the formation beyond the damaged or stimulated
                     zone near the well.

                     Therefore, to obtain the formation transmissibility, T f, the late part of the buildup plot is
                     re-aligned with another of the type curves, for which the value of T/F is again noted.
   289   290   291   292   293   294   295   296   297   298   299