Page 298 - Fundamentals of Reservoir Engineering
P. 298

OILWELL TESTING                                    234

                                  ∆p
                                       (psi)
                                   1
                               1 -
                                  Ct ∆

                                                                                      C= 1.7
                                    1500
                                                                                      C= 2.1
                                                                                      C= 2.5


                                    1400


                                     1300
                                         0                   .5                  1.0
                                                               log t ∆

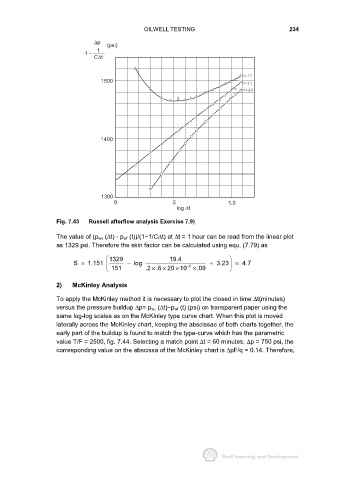
                     Fig. 7.43  Russell afterflow analysis Exercise 7.9)

                     The value of (p ws (∆t) - p wf (t))/(1−1/C∆t) at ∆t = 1 hour can be read from the linear plot
                     as 1329 psi. Therefore the skin factor can be calculated using equ. (7.79) as

                                        1329                19.4
                           S =  1.151         −  log               − 6     +  3.23    =  4.7
                                                               ×
                                                          ×
                                                      ×
                                         151        .2 .6 20 10 ×     .09
                     2)   McKinley Analysis

                     To apply the McKinley method it is necessary to plot the closed in time ∆t(minutes)
                     versus the pressure buildup ∆p= p w, (∆t)−p wf (t) (psi) on transparent paper using the
                     same log-log scales as on the McKinley type curve chart. When this plot is moved
                     laterally across the McKinley chart, keeping the abscissae of both charts together, the
                     early part of the buildup is found to match the type-curve which has the parametric
                     value T/F = 2500, fig. 7.44. Selecting a match point ∆t = 60 minutes, ∆p = 750 psi, the
                     corresponding value on the abscissa of the McKinley chart is ∆pF/q = 0.14. Therefore,
   293   294   295   296   297   298   299   300   301   302   303