Page 378 - Fundamentals of Reservoir Engineering
P. 378

NATURAL WATER INFLUX                                   313


                     PRESSURE
                          (psia)
                                 p =2740
                          2700    i
                                       2620

                          2500          p =2500
                                         1
                                             2395
                          2300                 p =2290
                                                2
                                                    2199
                          2100                        p =2109
                                                       3
                                                           2029
                                                             p =1949
                                                              4
                          1900
                                                                 1883
                                                                    p =1818
                                                                     5
                                                                        1760
                          1700                                             p =1702
                                                                            6
                                                                              1655
                                                                      p =1608        1571
                                                                       7
                          1500                                          p =1535             1507
                                                                         8
                                                                                p =1480           1460
                                                                                 9
                                                                                        p  =1440
                                                                                         10
                          1300
                               0     1             3     4      5      6     7      8      9    10
                                                        TIME (years)

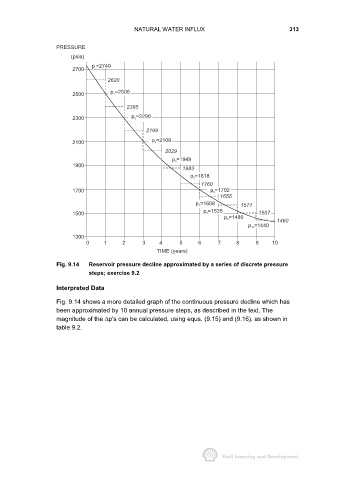
                     Fig. 9.14  Reservoir pressure decline approximated by a series of discrete pressure
                                steps; exercise 9.2

                     Interpreted Data

                     Fig. 9.14 shows a more detailed graph of the continuous pressure decline which has
                     been approximated by 10 annual pressure steps, as described in the text. The
                     magnitude of the ∆p's can be calculated, using equs. (9.15) and (9.16), as shown in
                     table 9.2.
   373   374   375   376   377   378   379   380   381   382   383