
Page 377 - Fundamentals of Reservoir Engineering
P. 377
NATURAL WATER INFLUX 312
R s B g
scf/stb rb/scf
600 0.006
R
B g s
500 0.005
400 0.004
300 0.003
200 0.002
100 0.001
0 0
0 1000 2000 3000
PRESSURE (psia)
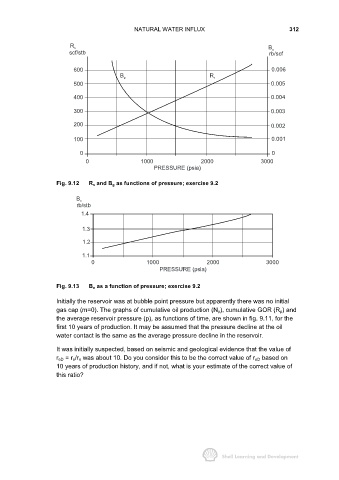
Fig. 9.12 R s and B g as functions of pressure; exercise 9.2
B o
rb/stb
1.4
1.3
1.2
1.1
0 1000 2000 3000
PRESSURE (psia)
Fig. 9.13 B o as a function of pressure; exercise 9.2
Initially the reservoir was at bubble point pressure but apparently there was no initial
gas cap (m=0). The graphs of cumulative oil production (N p), cumulative GOR (R p) and
the average reservoir pressure (p), as functions of time, are shown in fig. 9.11, for the
first 10 years of production. It may be assumed that the pressure decline at the oil
water contact is the same as the average pressure decline in the reservoir.
It was initially suspected, based on seismic and geological evidence that the value of
r eD = r e/r o was about 10. Do you consider this to be the correct value of r eD based on
10 years of production history, and if not, what is your estimate of the correct value of
this ratio?