Page 376 - Fundamentals of Reservoir Engineering
P. 376

NATURAL WATER INFLUX                                   311


                                               r = 9200’      140°                    sealing fault
                                                o


                                                               r?
                                                                e

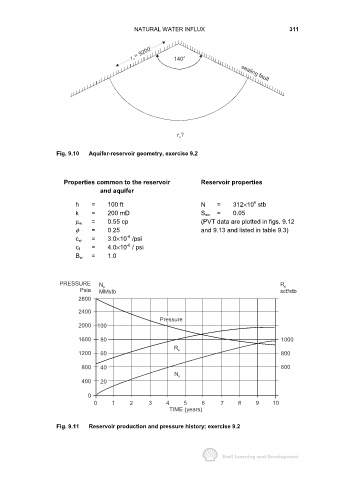
                     Fig. 9.10  Aquifer-reservoir geometry, exercise 9.2


                       Properties common to the reservoir               Reservoir properties
                                    and aquifer

                                                                                          6
                            h    =     100 ft                           N    =     312×10  stb
                            k    =     200 mD                           S wc  =    0.05
                                 =     0.55 cp                          (PVT data are plotted in figs. 9.12
                            µ w
                            φ    =     0.25                             and 9.13 and listed in table 9.3)
                                              -6
                                 =     3.0×10  /psi
                            c w
                                              -6
                                 =     4.0×10  / psi
                            c f
                                 =     1.0
                            B w


                      PRESSURE      N                                                              R p
                                     p
                             Psia   MMstb                                                          scf/stb
                             2800

                             2400
                                                         Pressure
                             2000  100

                             1600   80                                                              1000
                                                              R
                             1200   60                          p                                   800

                              800   40                                                              600
                                                              N p
                              400   20

                                0
                                  0     1      2     3     4      5     6     7      8     9     10
                                                            TIME (years)


                     Fig. 9.11  Reservoir production and pressure history; exercise 9.2
   371   372   373   374   375   376   377   378   379   380   381