
Page 461 - Fundamentals of Water Treatment Unit Processes : Physical, Chemical, and Biological
P. 461
416 Fundamentals of Water Treatment Unit Processes: Physical, Chemical, and Biological
include headloss and such water quality characteristics as
turbidity, disinfectant, and concentrations of certain biological
and chemical contaminants. Cartridge filter samples may
be taken perhaps every 3 months to ascertain process effect-
iveness.
PROBLEMS
13.1 Transport and Filter Coefficients for Viruses and
Giardia Cysts
Given
Two sands, California dune (d 10 ¼ 0.28 mm, UC 1.4)
and Muscatine (d 10 ¼ 0.78 mm, UC 1.0), were used
by Roebeck et al. (1962, p. 1277) in filtration experi-
ments with 0.610 m (2.0 ft) sand columns using
attenuated polio with results as shown in Figure 13.6.
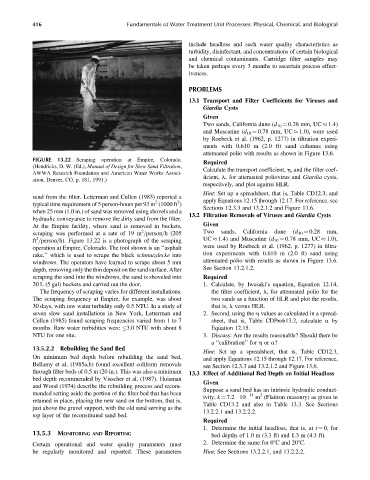
FIGURE 13.22 Scraping operation at Empire, Colorado.
Required
(Hendricks, D. W. (Ed.), Manual of Design for Slow Sand Filtration,
Calculate the transport coefficient, h, and the filter coef-
AWWA Research Foundation and American Water Works Associ-
ficient, l, for attenuated poliovirus and Giardia cysts,
ation, Denver, CO, p. 181, 1991.)
respectively, and plot against HLR.
Hint: Set up a spreadsheet, that is, Table CD12.3, and
sand from the filter. Letterman and Cullen (1985) reported a apply Equations 12.15 through 12.17. For reference, see
2
2
typical time requirement of 5 person-hours per 93 m (1000 ft )
Sections 12.3.3 and 13.2.1.2 and Figure 13.6.
when 25 mm (1.0 in.) of sand was removed using shovels and a
13.2 Filtration Removals of Viruses and Giardia Cysts
hydraulic conveyance to remove the dirty sand from the filter.
At the Empire facility, where sand is removed in buckets, Given
2
scraping was performed at a rate of 19 m =person=h (205 Two sands, California dune (d 10 ¼ 0.28 mm,
2 UC 1.4) and Muscatine (d 10 ¼ 0.78 mm, UC 1.0),
ft =person=h). Figure 13.22 is a photograph of the scraping
operation at Empire, Colorado. The tool shown is an ‘‘asphalt were used by Roebeck et al. (1962, p. 1277) in filtra-
rake,’’ which is used to scrape the black schmutzdecke into tion experiments with 0.610 m (2.0 ft) sand using
windrows. The operators have learned to scrape about 5 mm attenuated polio with results as shown in Figure 13.6.
depth, removing only the thin deposit on the sand surface. After See Section 13.2.1.2.
scraping the sand into the windrows, the sand is shoveled into Required
20 L (5 gal) buckets and carried out the door. 1. Calculate, by Iwasaki’s equation, Equation 12.14,
The frequency of scraping varies for different installations. the filter coefficient, l, for attenuated polio for the
The scraping frequency at Empire, for example, was about two sands as a function of HLR and plot the results,
30 days, with raw water turbidity only 0.5 NTU. In a study of that is, l versus HLR.
seven slow sand installations in New York, Letterman and 2. Second, using the h values as calculated in a spread-
Cullen (1985) found scraping frequencies varied from 1 to 7 sheet, that is, Table CDProb13.2, calculate a by
months. Raw water turbidities were 3.0 NTU with about 8 Equation 12.15.
NTU for one site. 3. Discuss: Are the results reasonable? Should there be
a ‘‘calibration’’ for h or a?
13.5.2.2 Rebuilding the Sand Bed
Hint: Set up a spreadsheet, that is, Table CD12.3,
On minimum bed depth before rebuilding the sand bed, and apply Equations 12.15 through 12.17. For reference,
Bellamy et al. (1985a,b) found excellent coliform removals see Section 12.3.3 and 13.2.1.2 and Figure 13.6.
through filter beds of 0.5 m (20 in.). This was also a minimum 13.3 Effect of Additional Bed Depth on Initial Headloss
bed depth recommended by Visscher et al. (1987). Huisman
Given
and Wood (1974) describe the rebuilding process and recom-
Suppose a sand bed has an intrinsic hydraulic conduct-
mended setting aside the portion of the filter bed that has been 11 2
ivity, k ¼ 7.2 10 m (Flatiron masonry) as given in
retained in place, placing the new sand on the bottom, that is,
Table CD13.2 and also in Table 13.3. See Sections
just above the gravel support, with the old sand serving as the
13.2.2.1 and 13.2.2.2.
top layer of the reconstituted sand bed.
Required
1. Determine the initial headloss, that is, at t ¼ 0, for
13.5.3 MONITORING AND REPORTING bed depths of 1.0 m (3.3 ft) and 1.3 m (4.3 ft).
Certain operational and water quality parameters must 2. Determine the same for 08C and 208C.
be regularly monitored and reported. These parameters Hint: See Sections 13.2.2.1, and 13.2.2.2.