
Page 456 - Fundamentals of Water Treatment Unit Processes : Physical, Chemical, and Biological
P. 456
Slow Sand Filtration 411
13.3.2.8.3 Headloss
Huisman and Wood calculated the total headloss across the
gravel support as 1.37 mm applying Darcy’s law to gravel
layers of sizes 0.7–36 mm and assuming HLR ¼ 0.5 m=h
(12.5 mgad). In other words, the headloss through the gravel
support is not significant.
13.3.3 SUPPORT SYSTEMS
For a process to work as a technology, various kinds of
support systems are necessary. These include instruments for
flow measurements, a pipe gallery, a means to access the
filters for scraping, etc.
13.3.3.1 Flow Measurements
The locations of flow measurement instruments are shown in
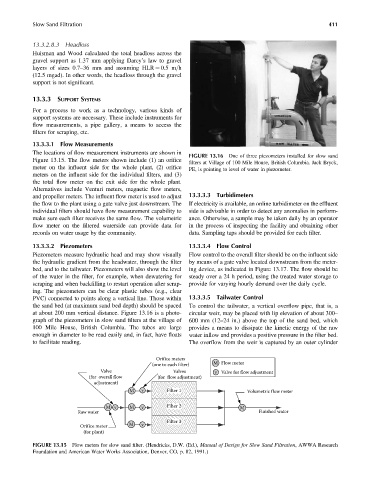
FIGURE 13.16 One of three piezometers installed for slow sand
Figure 13.15. The flow meters shown include (1) an orifice
filters at Village of 100 Mile House, British Columbia. Jack Bryck,
meter on the influent side for the whole plant, (2) orifice PE, is pointing to level of water in piezometer.
meters on the influent side for the individual filters, and (3)
the total flow meter on the exit side for the whole plant.
Alternatives include Venturi meters, magnetic flow meters,
and propeller meters. The influent flow meter is used to adjust 13.3.3.3 Turbidimeters
the flow to the plant using a gate valve just downstream. The If electricity is available, an online turbidimeter on the effluent
individual filters should have flow measurement capability to side is advisable in order to detect any anomalies in perform-
make sure each filter receives the same flow. The volumetric ance. Otherwise, a sample may be taken daily by an operator
flow meter on the filtered waterside can provide data for in the process of inspecting the facility and obtaining other
records on water usage by the community. data. Sampling taps should be provided for each filter.
13.3.3.2 Piezometers 13.3.3.4 Flow Control
Piezometers measure hydraulic head and may show visually Flow control to the overall filter should be on the influent side
the hydraulic gradient from the headwater, through the filter by means of a gate valve located downstream from the meter-
bed, and to the tailwater. Piezometers will also show the level ing device, as indicated in Figure 13.17. The flow should be
of the water in the filter, for example, when dewatering for steady over a 24 h period, using the treated water storage to
scraping and when backfilling to restart operation after scrap- provide for varying hourly demand over the daily cycle.
ing. The piezometers can be clear plastic tubes (e.g., clear
PVC) connected to points along a vertical line. Those within 13.3.3.5 Tailwater Control
the sand bed (at maximum sand bed depth) should be spaced To control the tailwater, a vertical overflow pipe, that is, a
at about 200 mm vertical distance. Figure 13.16 is a photo- circular weir, may be placed with lip elevation of about 300–
graph of the piezometers in slow sand filters at the village of 600 mm (12–24 in.) above the top of the sand bed, which
100 Mile House, British Columbia. The tubes are large provides a means to dissipate the kinetic energy of the raw
enough in diameter to be read easily and, in fact, have floats water inflow and provides a positive pressure in the filter bed.
to facilitate reading. The overflow from the weir is captured by an outer cylinder
Orifice meters
(one to each filter) M Flow meter
Valve Valves v Valve for flow adjustment
(for overall flow (for flow adjustment)
adjustment)
M v Filter 1 Volumetric flow meter
M v M v Filter 2 M
Raw water Finished water
Filter 3
Orifice meter M v
(for plant)
FIGURE 13.15 Flow meters for slow sand filter. (Hendricks, D.W. (Ed.), Manual of Design for Slow Sand Filtration, AWWA Research
Foundation and American Water Works Association, Denver, CO, p. 82, 1991.)