
Page 454 - Fundamentals of Water Treatment Unit Processes : Physical, Chemical, and Biological
P. 454
Slow Sand Filtration 409
Slow sand Slow sand Slow sand Slow sand Legend
filter no. 1 filter no. 2 filter no. 3 filter no. 4
D Drain
DD Drawdown
FW Filtered water
UD UD UD UD UD UD UD UD UD UD UD UD OF Overflow
TW Treated water
UD Underdrain
OF OF OF OF UF Underdrain fill
Gate valve,
DD DD DD DD normally closed
Gate valve,
Influent
normally open
M
water M Flow meter
Influent lines
M M M M Effluent lines
D UF D FW —treated water
OF/D/D
Effluent lines
—waste water
Future expansion
M
FW
D
Chlorine contact tank and reservoir
OF
TW
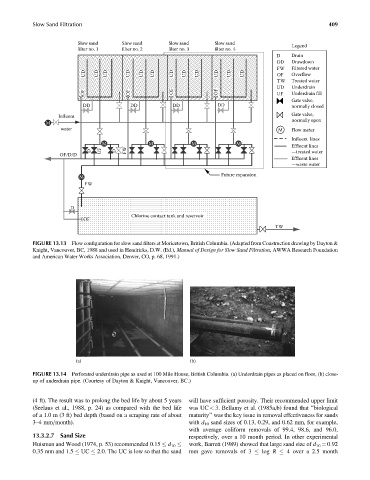
FIGURE 13.13 Flow configuration for slow sand filters at Moricetown, British Columbia. (Adapted from Construction drawing by Dayton &
Knight, Vancouver, BC, 1988 and used in Hendricks, D.W. (Ed.), Manual of Design for Slow Sand Filtration, AWWA Research Foundation
and American Water Works Association, Denver, CO, p. 68, 1991.)
(a) (b)
FIGURE 13.14 Perforated underdrain pipe as used at 100 Mile House, British Columbia. (a) Underdrain pipes as placed on floor, (b) close-
up of underdrain pipe. (Courtesy of Dayton & Knight, Vancouver, BC.)
(4 ft). The result was to prolong the bed life by about 5 years will have sufficient porosity. Their recommended upper limit
(Seelaus et al., 1988, p. 24) as compared with the bed life was UC < 3. Bellamy et al. (1985a,b) found that ‘‘biological
of a 1.0 m (3 ft) bed depth (based on a scraping rate of about maturity’’ was the key issue in removal effectiveness for sands
3–4mm=month). with d 10 sand sizes of 0.13, 0.29, and 0.62 mm, for example,
with average coliform removals of 99.4, 98.6, and 96.0,
13.3.2.7 Sand Size respectively, over a 10 month period. In other experimental
work, Barrett (1989) showed that large sand size of d 10 ¼ 0.92
Huisman and Wood (1974, p. 53) recommended 0.15 d 10
0.35 mm and 1.5 UC 2.0. The UC is low so that the sand mm gave removals of 3 log R 4 over a 2.5 month