
Page 449 - Fundamentals of Water Treatment Unit Processes : Physical, Chemical, and Biological
P. 449
404 Fundamentals of Water Treatment Unit Processes: Physical, Chemical, and Biological
A B C D E
1
HGL
Tailwater Headwater 2
Schmutzdecke 3 4 5
Weir
Sand
Product
water Gravel
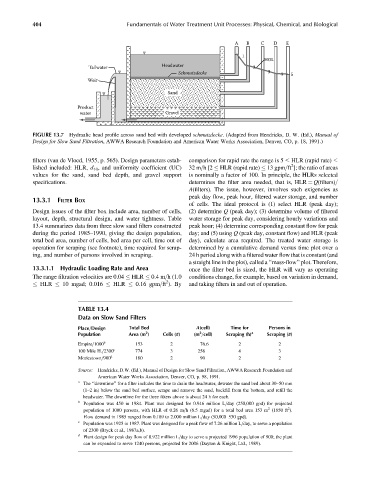
FIGURE 13.7 Hydraulic head profile across sand bed with developed schmutzdecke. (Adapted from Hendricks, D. W. (Ed.), Manual of
Design for Slow Sand Filtration, AWWA Research Foundation and American Water Works Association, Denver, CO, p. 18, 1991.)
filters (van de Vloed, 1955, p. 565). Design parameters estab- comparison for rapid rate the range is 5 HLR (rapid rate)
2
lished included: HLR, d 10 , and uniformity coefficient (UC) 32 m=h[2 HLR (rapid rate) 13 gpm=ft ]; the ratio of areas
values for the sand, sand bed depth, and gravel support is nominally a factor of 100. In principle, the HLRs selected
specifications. determines the filter area needed, that is, HLR ¼ Q(filters)=
A(filters). The issue, however, involves such exigencies as
peak day flow, peak hour, filtered water storage, and number
13.3.1 FILTER BOX
of cells. The ideal protocol is (1) select HLR (peak day);
Design issues of the filter box include area, number of cells, (2) determine Q (peak day); (3) determine volume of filtered
layout, depth, structural design, and water tightness. Table water storage for peak day, considering hourly variations and
13.4 summarizes data from three slow sand filters constructed peak hour; (4) determine corresponding constant flow for peak
during the period 1985–1990, giving the design population, day; and (5) using Q (peak day, constant flow) and HLR (peak
total bed area, number of cells, bed area per cell, time out of day), calculate area required. The treated water storage is
operation for scraping (see footnote), time required for scrap- determined by a cumulative demand versus time plot over a
ing, and number of persons involved in scraping. 24 h period along with a filtered water flow that is constant (and
a straight line in the plot), called a ‘‘mass-flow’’ plot. Therefore,
13.3.1.1 Hydraulic Loading Rate and Area once the filter bed is sized, the HLR will vary as operating
The range filtration velocities are 0.04 HLR 0.4 m=h (1.0 conditions change, for example, based on variation in demand,
2
HLR 10 mgad; 0.016 HLR 0.16 gpm=ft ). By and taking filters in and out of operation.
TABLE 13.4
Data on Slow Sand Filters
Place=Design Total Bed A(cell) Time for Persons in
2
2
Population Area (m ) Cells (#) (m =cell) Scraping (h) a Scraping (#)
Empire=1000 b 153 2 76.6 2 2
100 Mile H.=2300 c 774 3 258 4 3
Moricetown=900 d 180 2 90 2 2
Source: Hendricks, D.W. (Ed.), Manual of Design for Slow Sand Filtration, AWWA Research Foundation and
American Water Works Association, Denver, CO, p. 98, 1991.
a
The ‘‘downtime’’ for a filter includes the time to drain the headwater, dewater the sand bed about 30–50 mm
(1–2 in) below the sand bed surface, scrape and remove the sand, backfill from the bottom, and refill the
headwater. The downtime for the three filters above is about 24 h for each.
b
Population was 450 in 1984. Plant was designed for 0.946 million L=day (250,000 gpd) for projected
2
2
population of 1000 persons, with HLR of 0.26 m=h (6.5 mgad) for a total bed area 153 m (1650 ft ).
Flow demand in 1985 ranged from 0.189 to 2.000 million L=day (50,000–530 gpd).
c
Population was 1925 in 1987. Plant was designed for a peak flow of 7.26 million L=day, to serve a population
of 2300 (Bryck et al., 1987a,b).
d
Plant design for peak day flow of 0.922 million L=day to serve a projected 1996 population of 900; the plant
can be expanded to serve 1240 persons, projected for 2006 (Dayton & Knight, Ltd., 1989).