Page 632 - Fundamentals of Water Treatment Unit Processes : Physical, Chemical, and Biological
P. 632

Gas Transfer                                                                                     587


                1.0                                            or


                                                                                 C s   C  ¼   K L a  Z    (18:59)
                           1 log cycle                                          C s   C in   2:3   v
                                                                            log
                (C s –C)/(C s –C o )  28 min                   Equation 18.59 plots as a semi-log relationship; if C data are

                                                               obtained along the column, the slope is  K L a=2.3v. As noted
                                                               previously, the model is steady state, that is, [qC=qt] o ¼ 0.


                                              Outlier          18.2.3.3.1  Gas Uptake
                                                               Figure 18.11b illustrates the increase in dissolved gas concen-
                                                               tration, C, as distance from the top of the column, Z,
                                                               increases; (C s   C) decreases, as seen, as C increases.
                0.1
                   0       5      10      15     20      25    18.2.3.3.2  Gas Stripping
                                Elapsed time (min)
                                                               Figure 18.11c illustrates the decrease in dissolved gas con-
            FIGURE 18.10 Results of an aeration test—laboratory scale (Table  centration, C, with distance due to gas stripping; usually, the
            18.5 data).                                        stripping gas is air, although steam is mentioned in the litera-
                                                               ture. The assumption adopted here, for a simplistic mathemat-
                                                               ical depiction, is that the concentration of gas ‘‘A’’ being
            or
                                                               stripped is zero in the bubbles; therefore, C s ¼ 0. The result
                                                               is that Equation 18.59 reduces to
                             qC
                            v   ¼ K L a(C s   C)       (18:56)
                             qZ                                                    C       K L a
                                                                               log    ¼        Z          (18:60)
                                                                                  C in    2:3   v
            Separating variables and integrating gives
                                                               Notes:

                         C pit          Z ð 0
                          ð                                       . The main assumption applied to Equation 18.54 is
                              dC          K L a
                                             dZ        (18:57)      that dispersion is negligible. If the dispersion coeffi-
                                    ¼
                            (C s   C)      v
                                        0                           cient is measured, for example, by salt or dye tests
                         C in
                                                                    (applying Equation 18.54 for the condition that there

                             C s   C     K L a                      is no reaction), then Equation 18.54 must be solved
                          ln         ¼       Z         (18:58)
                             C s   C in    v                        numerically.
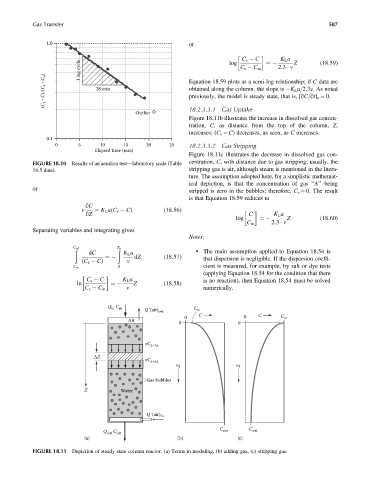
                                     Q  C
                                      in
                                        in
                                                 Q΄(air) out     C in
                                                                  C                   C
                                                              0                  0           C in
                                           Air
                                                            0                  0
                                                 vC z–Δz
                                ΔZ
                                                 vC z+Δz
                                                            Z                   Z

                                                 Gas bubbles
                             Z           Water


                                                 Q΄(air) in

                                                                         C
                                   Q out  C out                           out      C out
                             (a)                           (b)                 (c)
            FIGURE 18.11 Depiction of steady state column reactor. (a) Terms in modeling, (b) adding gas, (c) stripping gas.
   627   628   629   630   631   632   633   634   635   636   637