Page 631 - Fundamentals of Water Treatment Unit Processes : Physical, Chemical, and Biological
P. 631

586                            Fundamentals of Water Treatment Unit Processes: Physical, Chemical, and Biological
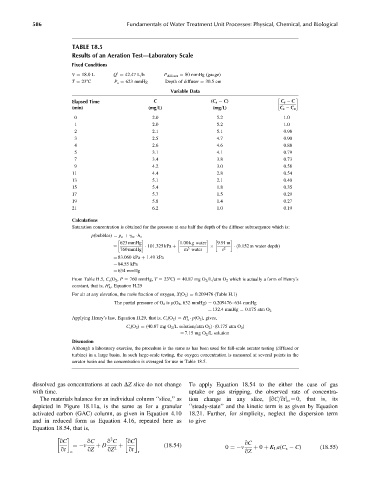


                         TABLE 18.5
                         Results of an Aeration Test—Laboratory Scale
                         Fixed Conditions
                         V ¼ 18.0 L   Q ¼ 42.47 L=h    P diffuser ¼ 80 mmHg (gauge)
                                       0
                         T ¼ 238C      P a ¼ 623 mmHg  Depth of diffuser ¼ 30.5 cm
                                                         Variable Data

                         Elapsed Time               C                 (C s   C)              C s   C
                         (min)                    (mg=L)               (mg=L)                C s   C o
                          0                        2.0                  5.2                   1.0
                          1                        2.0                  5.2                   1.0
                          2                        2.1                  5.1                   0.98
                          3                        2.5                  4.7                   0.90
                          4                        2.6                  4.6                   0.88
                          5                        3.1                  4.1                   0.79
                          7                        3.4                  3.8                   0.73
                          9                        4.2                  3.0                   0.58
                         11                        4.4                  2.8                   0.54
                         13                        5.1                  2.1                   0.40
                         15                        5.4                  1.8                   0.35
                         17                        5.7                  1.5                   0.29
                         19                        5.8                  1.4                   0.27
                         21                        6.2                  1.0                   0.19

                         Calculations
                         Saturation concentration is obtained for the pressure at one half the depth of the diffuser submergence which is:
                               p(bubbles) ¼ p a þ g w   h o

                                         623 mmHg           1:00 kg water  9:91 m
                                                                                (0:152 m water depth)
                                      ¼            101:325 kPa þ  3        2
                                         760 mmHg             m water     s
                                      ¼ 83.060 kPa þ 1.49 kPa
                                      ¼ 84.55 kPa
                                      ¼ 634 mmHg
                         From Table H.5, C s (O 2 , P ¼ 760 mmHg, T ¼ 238C) ¼ 40.87 mg O 2 =L=atm O 2 which is actually a form of Henry’s
                                     s
                         constant, that is, H , Equation H.29
                                     A
                         For air at any elevation, the mole fraction of oxygen, X(O 2 ) ¼ 0.209476 (Table H.1)
                                       The partial pressure of O 2 is p(O 2 , 632 mmHg) ¼ 0.209476   634 mmHg
                                                                     ¼ 132.4 mmHg ¼ 0.175 atm O 2
                                                               s
                         Applying Henry’s law, Equation H.29, that is, C s (O 2 ) ¼ H   p(O 2 ), gives,
                                                              A
                                           C s (O 2 ) ¼ (40.87 mg O 2 =L solution=atm O 2 )   (0.175 atm O 2 )
                                                            ¼ 7.15 mg O 2 =L solution
                         Discussion
                         Although a laboratory exercise, the procedure is the same as has been used for full-scale aerator testing (diffused or
                         turbine) in a large basin. In such large-scale testing, the oxygen concentration is measured at several points in the
                         aerator basin and the concentration is averaged for use in Table 18.5.


            dissolved gas concentrations at each DZ slice do not change  To apply Equation 18.54 to the either the case of gas
            with time.                                         uptake or gas stripping, the observed rate of concentra-
              The materials balance for an individual column ‘‘slice,’’ as  tion change in any slice, [qC=qt] o ¼ 0, that is, its
            depicted in Figure 18.11a, is the same as for a granular  ‘‘steady-state’’ and the kinetic term is as given by Equation
            activated carbon (GAC) column, as given in Equation 4.10  18.21. Further, for simplicity, neglect the dispersion term
            and in reduced form as Equation 4.16, repeated here as  to give
            Equation 18.54, that is,
                                     2
                     qC       qC    q C    qC                                     qC
                         ¼ v     þ D                   (18:54)
                     qt       qZ    qZ 2  þ  qt                            0 ¼ v    þ 0 þ K L a(C s   C)  (18:55)
                        o                     r                                   qZ
   626   627   628   629   630   631   632   633   634   635   636