
Page 855 - Fundamentals of Water Treatment Unit Processes : Physical, Chemical, and Biological
P. 855
810 Appendix D: Fluid Mechanics—Reviews of Selected Topics
TABLE CDD.6
Combined Pipe Flow and Compression Spreadsheet
Flow is assumed to be isothermal in pipe and adiabatic across compressor
1 Gas Constants 2 Hydraulic Constants
Constant Value Units Ref. Const. Value Units
1
R ¼ 8.314510 J K mol 1 Table B.2 f ¼ 0.012 Pipe friction
MW(air) ¼ 0.02896 kg=mol Table B.7 r w ¼ 998 kg=m 3
k ¼ 1.395 C ¼ 0.61 Orifice coefficient
g ¼ 9.81
4 Ambient Conditions 5 Intake Conditions at ‘‘1’’
z(elev)
p(atm) T(atm) z 1 r(atm) z 1 rg P 1 T 1 r 1
3
3
(ft) (m) (Pa) (C) (m) (kg=m ) (Pa) (Pa) (C) (kg=m )
0 0 101,325 0 10 1.292 127 101,325 0 1.2922
5500 1676 82,083 0 10 1.047 103 82,083 0 1.047
5500 1676 82,083 0 10 1.047 103 82,083 0 1.047
5500 1676 82,083 0 10 1.047 103 82,083 0 1.047
5500 1676 82,083 0 10 1.047 103 82,083 0 1.047
5500 1676 82,083 0 10 1.047 103 82,083 0 1.047
5500 1676 82,083 0 10 1.047 103 82,083 0 1.047
Elevation above sea level Density of air for ambient conditions Temperature at ‘‘1’’
Measured (or assumed) atmospheric temperature Pressure at intake
Elevation of intake pipe above a datum Density of
Computed pressure from Lide data Energy of air at intake due to elev.
Other categories calculated in spreadsheet
3 Air flow for aerated grit chamber (Metcalf & Eddy, 1991),
6 Air flow to grit chamber
7 Pipe design ‘‘1–2’’
8 Calculation of HGL level at ‘‘2’’
9 Conditions at ‘‘5’’
10 Orifice flow=sizing=Dp determinations to get p 4
11 Pressure loss between ‘‘3’’ and ‘‘4’’ to get HGL 3
12 Summary - for input data to compressor
13 Ambient and operating conditions
14 Standard temperature and pressure conditions and power
15 McCabe et al. (1993)
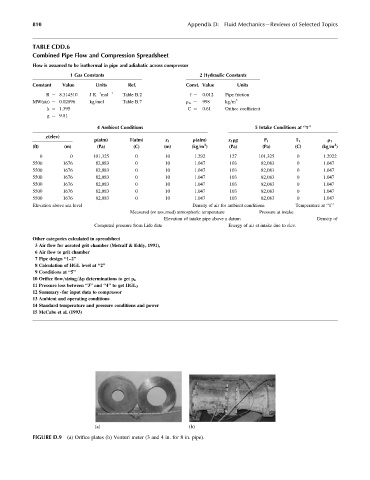
(a) (b)
FIGURE D.9 (a) Orifice plates (b) Venturi meter (3 and 4 in. for 8 in. pipe).