
Page 98 - Fundamentals of Water Treatment Unit Processes : Physical, Chemical, and Biological
P. 98
Models 53
21
21
24
25
Reuse demonstration plant 20
20
20 30
22
18 22 31
22
10 19
9
19
11 12 23
13
14
15
8 16 16 17
7 6 17
5
2
4 3
1
3
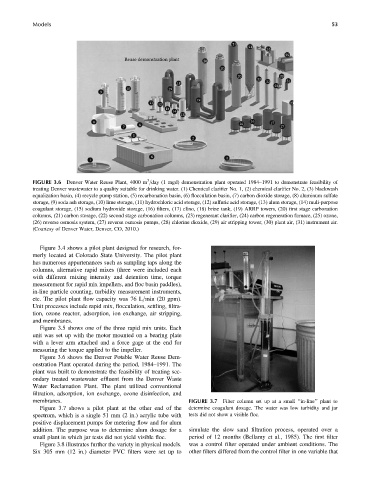
FIGURE 3.6 Denver Water Reuse Plant, 4000 m =day (1 mgd) demonstration plant operated 1984–1991 to demonstrate feasibility of
treating Denver wastewater to a quality suitable for drinking water. (1) Chemical clarifier No. 1, (2) chemical clarifier No. 2, (3) blackwash
equalization basin, (4) recycle pump station, (5) recarbonation basin, (6) flocculation basin, (7) carbon dioxide storage, (8) aluminum sulfate
storage, (9) soda ash storage, (10) lime storage, (11) hydrochloric acid storage, (12) sulfuric acid storage, (13) alum storage, (14) muli-purpose
coagulant storage, (15) sodium hydroxide storage, (16) filters, (17) clino, (18) brine tank, (19) ARRP towers, (20) first stage carbonation
columns, (21) carbon storage, (22) second stage carbonation columns, (23) regenerant clarifier, (24) carbon regeneration furnace, (25) ozone,
(26) reverse osmosis system, (27) reverse osmosis pumps, (28) chlorine dioxide, (29) air stripping tower, (30) plant air, (31) instrument air.
(Courtesy of Denver Water, Denver, CO, 2010.)
Figure 3.4 shows a pilot plant designed for research, for-
merly located at Colorado State University. The pilot plant
has numerous appurtenances such as sampling taps along the
columns, alternative rapid mixes (three were included each
with different mixing intensity and detention time, torque
measurement for rapid mix impellers, and floc basin paddles),
in-line particle counting, turbidity measurement instruments,
etc. The pilot plant flow capacity was 76 L=min (20 gpm).
Unit processes include rapid mix, flocculation, settling, filtra-
tion, ozone reactor, adsorption, ion exchange, air stripping,
and membranes.
Figure 3.5 shows one of the three rapid mix units. Each
unit was set up with the motor mounted on a bearing plate
with a lever arm attached and a force gage at the end for
measuring the torque applied to the impeller.
Figure 3.6 shows the Denver Potable Water Reuse Dem-
onstration Plant operated during the period, 1984–1991. The
plant was built to demonstrate the feasibility of treating sec-
ondary treated wastewater effluent from the Denver Waste
Water Reclamation Plant. The plant utilized conventional
filtration, adsorption, ion exchange, ozone disinfection, and
membranes. FIGURE 3.7 Filter column set up at a small ‘‘in-line’’ plant to
Figure 3.7 shows a pilot plant at the other end of the determine coagulant dosage. The water was low turbidity and jar
spectrum, which is a single 51 mm (2 in.) acrylic tube with tests did not show a visible floc.
positive displacement pumps for metering flow and for alum
addition. The purpose was to determine alum dosage for a simulate the slow sand filtration process, operated over a
small plant in which jar tests did not yield visible floc. period of 12 months (Bellamy et al., 1985). The first filter
Figure 3.8 illustrates further the variety in physical models. was a control filter operated under ambient conditions. The
Six 305 mm (12 in.) diameter PVC filters were set up to other filters differed from the control filter in one variable that