
Page 153 - Gas Wettability of Reservoir Rock Surfaces with Porous Media
P. 153
Effect of Gas Wettability on the Surface Properties CHAPTER 4 137
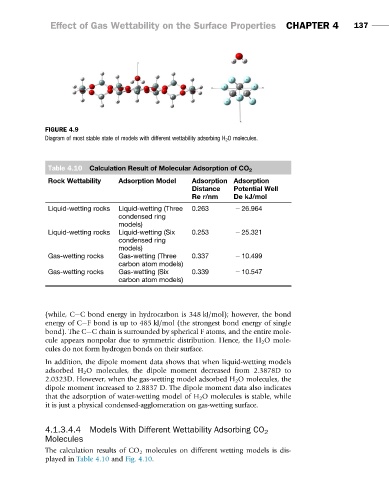
FIGURE 4.9
Diagram of most stable state of models with different wettability adsorbing H 2 O molecules.
Table 4.10 Calculation Result of Molecular Adsorption of CO 2
Rock Wettability Adsorption Model Adsorption Adsorption
Distance Potential Well
Re r/nm De kJ/mol
Liquid-wetting rocks Liquid-wetting (Three 0.263 2 26.964
condensed ring
models)
Liquid-wetting rocks Liquid-wetting (Six 0.253 2 25.321
condensed ring
models)
Gas-wetting rocks Gas-wetting (Three 0.337 2 10.499
carbon atom models)
Gas-wetting rocks Gas-wetting (Six 0.339 2 10.547
carbon atom models)
(while, C C bond energy in hydrocarbon is 348 kJ/mol); however, the bond
energy of C F bond is up to 485 kJ/mol (the strongest bond energy of single
bond). The C C chain is surrounded by spherical F atoms, and the entire mole-
cule appears nonpolar due to symmetric distribution. Hence, the H 2 O mole-
cules do not form hydrogen bonds on their surface.
In addition, the dipole moment data shows that when liquid-wetting models
adsorbed H 2 O molecules, the dipole moment decreased from 2.3878D to
2.0323D. However, when the gas-wetting model adsorbed H 2 O molecules, the
dipole moment increased to 2.8837 D. The dipole moment data also indicates
that the adsorption of water-wetting model of H 2 O molecules is stable, while
it is just a physical condensed-agglomeration on gas-wetting surface.
4.1.3.4.4 Models With Different Wettability Adsorbing CO 2
Molecules
The calculation results of CO 2 molecules on different wetting models is dis-
played in Table 4.10 and Fig. 4.10.