Page 58 - Gas Wettability of Reservoir Rock Surfaces with Porous Media
P. 58

80

                                   70

                                   60                     Water
                                                          Oil
                                  θ/º  50

                                   40

                                   30

                                   20
                                        0   1000   2000  3000  4000  5000
                                                              –1
                                              CTAB concentration/(mg*L )
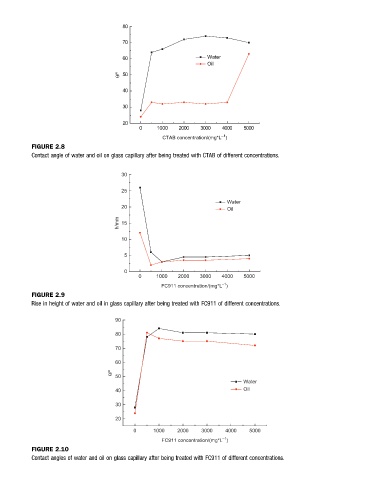
          FIGURE 2.8
          Contact angle of water and oil on glass capillary after being treated with CTAB of different concentrations.


                                   30

                                   25
                                                                Water
                                   20
                                                                Oil
                                  h/mm  15

                                   10

                                   5

                                   0
                                       0    1000  2000  3000  4000   5000
                                                               –1
                                              FC911 concentration/(mg*L )
          FIGURE 2.9
          Rise in height of water and oil in glass capillary after being treated with FC911 of different concentrations.

                                 90

                                 80
                                 70
                                 60
                                θ/º
                                 50
                                                                    Water
                                 40                                 Oil

                                 30
                                 20
                                      0     1000  2000   3000  4000   5000
                                                               –1
                                              FC911 concentration/(mg*L )
          FIGURE 2.10
          Contact angles of water and oil on glass capillary after being treated with FC911 of different concentrations.
   53   54   55   56   57   58   59   60   61   62   63