
Page 118 - Gas Adsorption Equilibria
P. 118
104 Chapter 2
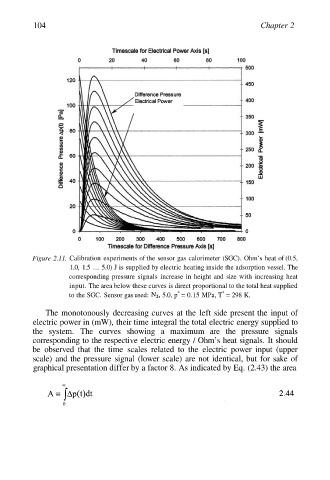
Figure 2.11. Calibration experiments of the sensor gas calorimeter (SGC). Ohm’s heat of (0.5,
1.0, 1.5 ... 5.0) J is supplied by electric heating inside the adsorption vessel. The
corresponding pressure signals increase in height and size with increasing heat
input. The area below these curves is direct proportional to the total heat supplied
*
*
to the SGC. Sensor gas used: 5.0, p = 0.15 MPa, T = 298 K.
The monotonously decreasing curves at the left side present the input of
electric power in (mW), their time integral the total electric energy supplied to
the system. The curves showing a maximum are the pressure signals
corresponding to the respective electric energy / Ohm’s heat signals. It should
be observed that the time scales related to the electric power input (upper
scale) and the pressure signal (lower scale) are not identical, but for sake of
graphical presentation differ by a factor 8. As indicated by Eq. (2.43) the area