
Page 119 - Gas Adsorption Equilibria
P. 119
2. Volumetry / Manometry 105
below the signal pressure curves and the total Ohm’s heat
supplied (Q) are linearly related, i. e. we have The respective
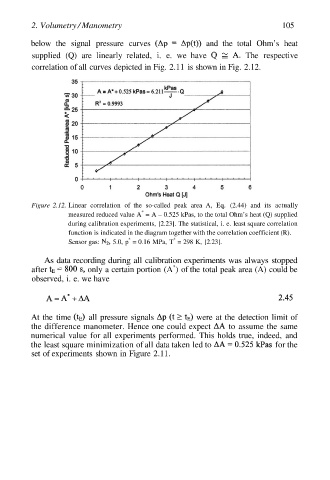
correlation of all curves depicted in Fig. 2.11 is shown in Fig. 2.12.
*
Figure 2.12. Linear correlation of the so-called peak area A, Eq. (2.44) and its actually
*
measured reduced value A = A – 0.525 kPas, to the total Ohm’s heat (Q) supplied
during calibration experiments, [2.23]. The statistical, i. e. least square correlation
function is indicated in the diagram together with the correlation coefficient (R).
*
*
Sensor gas: 5.0, p = 0.16 MPa, T = 298 K, [2.23].
As data recording during all calibration experiments was always stopped
*
after only a certain portion (A ) of the total peak area (A) could be
observed, i. e. we have
At the time all pressure signals were at the detection limit of
the difference manometer. Hence one could expect to assume the same
numerical value for all experiments performed. This holds true, indeed, and
the least square minimization of all data taken led to for the
set of experiments shown in Figure 2.11.