
Page 236 - gas transport in porous media
P. 236
Stockman
232
Bounce-Back Interpretation
13.4.1
During the development of lattice gas automata, it was noted (Cornubert, 1991) that
the traditional bounce-back condition did not put the zero-velocity boundary on the
solid nodes, but rather, at a position roughly halfway between a solid node and the
adjacent fluid node. The accuracy of the reinterpreted bounce-back is a function of
τ (thus the viscosity; Chen et al., 1996), but the nature of the variation is not made
clear in most publications.
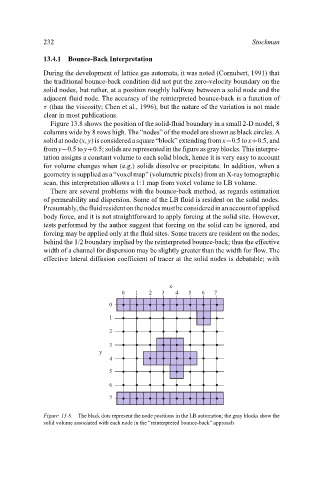
Figure 13.8 shows the position of the solid-fluid boundary in a small 2-D model, 8
columns wide by 8 rows high. The “nodes” of the model are shown as black circles. A
solid at node (x, y) is considered a square “block” extending from x−0.5 to x+0.5, and
from y−0.5 to y+0.5; solids are represented in the figure as gray blocks. This interpre-
tation assigns a constant volume to each solid block, hence it is very easy to account
for volume changes when (e.g.) solids dissolve or precipitate. In addition, when a
geometry is supplied as a “voxel map” (volumetric pixels) from an X-ray tomographic
scan, this interpretation allows a 1:1 map from voxel volume to LB volume.
There are several problems with the bounce-back method, as regards estimation
of permeability and dispersion. Some of the LB fluid is resident on the solid nodes.
Presumably, thefluidresidentonthenodesmustbeconsideredinanaccountofapplied
body force, and it is not straightforward to apply forcing at the solid site. However,
tests performed by the author suggest that forcing on the solid can be ignored, and
forcing may be applied only at the fluid sites. Some tracers are resident on the nodes,
behind the 1/2 boundary implied by the reinterpreted bounce-back; thus the effective
width of a channel for dispersion may be slightly greater than the width for flow. The
effective lateral diffusion coefficient of tracer at the solid nodes is debatable; with
x
0 1 2 3 4 5 6 7
0
1
2
3
y
4
5
6
7
Figure 13.8. The black dots represent the node positions in the LB automaton; the gray blocks show the
solid volume associated with each node in the “reinterpreted bounce-back” approach