
Page 302 - gas transport in porous media
P. 302
Rossabi
300
must be solved include long term and drift free operation. The drift problems are not
insurmountable, however, and if minimally invasive emplacement and data recovery
can be worked out, micro sensors will ultimately be installed for high resolution
measurements of subsurface flow behavior.
17.7 CONCLUSIONS
There are several technologies available for measuring subsurface gas flow depend-
ing on the desired application. Because of their small size, accuracy and simplicity,
Pitot tubes and thermal flow sensors are most often selected for precise flow field
measurements. Their inherent physical characteristics can be used to select the appro-
priate type of sensor for a particular application. For low fluid velocity applications
(< 1 m/sec), thermal sensors provide a strong dynamic response while Pitot tubes
produce a much weaker response because of the low differential pressure at that flow
rate. At high flow rates (> 15 m/sec) and correspondingly high differential pressure,
the Pitot tube is superior to a thermal flow sensor which has a lower sensitivity to
small changes in flow at those rates (Ismail and Davidian, 1999).
Other flow sensors may also be appropriate for measuring subsurface flow partic-
ularly in process-like applications. The user of these instruments must understand her
system and measurement objectives well enough to select the right sensor. Additional
information can be obtained from several national and international engineering and
standards organizations including the International Organization for Standards (ISO)
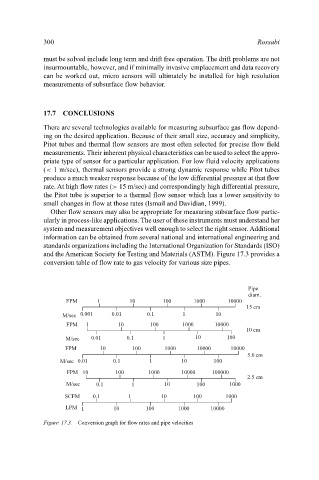
and the American Society for Testing and Materials (ASTM). Figure 17.3 provides a
conversion table of flow rate to gas velocity for various size pipes.
Pipe
diam.
FPM 1 10 100 1000 10000
15 cm
M/sec 0.001 0.01 0.1 1 10
FPM 1 10 100 1000 10000
10 cm
M/sec 0.01 0.1 1 10 100
FPM 10 100 1000 10000 10000
5.0 cm
M/sec 0.01 0.1 1 10 100
FPM 10 100 1000 10000 100000
2.5 cm
M/sec 0.1 1 10 100 1000
SCFM 0.1 1 10 100 1000
LPM 1 10 100 1000 10000
Figure 17.3. Conversion graph for flow rates and pipe velocities