
Page 341 - gas transport in porous media
P. 341
342
1000000
100000 Phelan
10000
Surface flux (pg/min) 1000
100
10
1
0 10 20 30 40 50 60 70 80 90
Time (days)
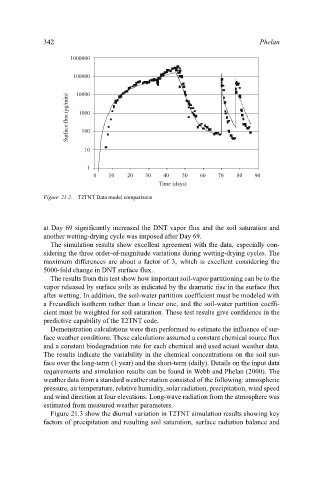
Figure 21.2. T2TNT Data model comparisons
at Day 69 significantly increased the DNT vapor flux and the soil saturation and
another wetting-drying cycle was imposed after Day 69.
The simulation results show excellent agreement with the data, especially con-
sidering the three order-of-magnitude variations during wetting-drying cycles. The
maximum differences are about a factor of 3, which is excellent considering the
5000-fold change in DNT surface flux.
The results from this test show how important soil-vapor partitioning can be to the
vapor released by surface soils as indicated by the dramatic rise in the surface flux
after wetting. In addition, the soil-water partition coefficient must be modeled with
a Freundlich isotherm rather than a linear one, and the soil-water partition coeffi-
cient must be weighted for soil saturation. These test results give confidence in the
predictive capability of the T2TNT code.
Demonstration calculations were then performed to estimate the influence of sur-
face weather conditions. These calculations assumed a constant chemical source flux
and a constant biodegradation rate for each chemical and used actual weather data.
The results indicate the variability in the chemical concentrations on the soil sur-
face over the long-term (1 year) and the short-term (daily). Details on the input data
requirements and simulation results can be found in Webb and Phelan (2000). The
weather data from a standard weather station consisted of the following: atmospheric
pressure, air temperature, relative humidity, solar radiation, precipitation, wind speed
and wind direction at four elevations. Long-wave radiation from the atmosphere was
estimated from measured weather parameters.
Figure 21.3 show the diurnal variation in T2TNT simulation results showing key
factors of precipitation and resulting soil saturation, surface radiation balance and