
Page 345 - gas transport in porous media
P. 345
346
1.00E+05 Kabul, Afghanistan Phelan
1.00E+04
TNT Solid-phase concentration (ng/g) 1.00E+02
1.00E+03
1.00E+01
1.00E+00
1.00E–01
0 5 0 100 150 200 250 300 350
Time (days)
Ft. Leonard Wood, Missouri, USA
1.00E+05
1.00E+04
TNT Solid-phase concentration (ng/g) 1.00E+02
1.00E+03
1.00E+01
1.00E+00
1.00E–01
0 0 5 100 150 200 250 300 350
Time (days)
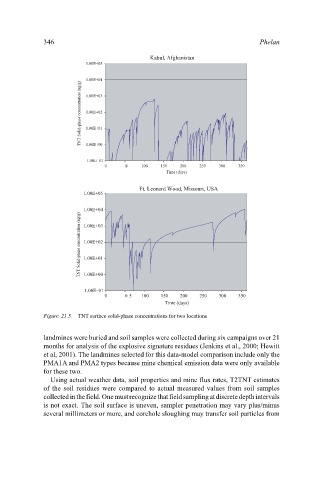
Figure 21.5. TNT surface solid-phase concentrations for two locations
landmines were buried and soil samples were collected during six campaigns over 21
months for analysis of the explosive signature residues (Jenkins et al., 2000; Hewitt
et al, 2001). The landmines selected for this data-model comparison include only the
PMA1A and PMA2 types because mine chemical emission data were only available
for these two.
Using actual weather data, soil properties and mine flux rates, T2TNT estimates
of the soil residues were compared to actual measured values from soil samples
collectedinthefield. Onemustrecognizethatfieldsamplingatdiscretedepthintervals
is not exact. The soil surface is uneven, sampler penetration may vary plus/minus
several millimeters or more, and corehole sloughing may transfer soil particles from