Page 347 - gas transport in porous media
P. 347

348
                                         1E+05
                                         1E+04                                  4       Phelan
                                         1E+03
                                         1E+02                                  3
                                        DNT total concentration (ng/g)  1E–01  Surface  2  Precipitation (cm/hr)
                                         1E+01
                                         1E+00
                                         1E–02
                                         1E–03
                                         1E–04
                                         1E–05
                                         1E–06
                                         1E–07
                                                                        3 to 6 cm
                                         1E–08                          0 to 3 cm  1
                                                                        Precip (cm/hr)
                                         1E–09
                                         1E–10                                  0
                                            14-Jul  24-Jul  3-Aug  13-Aug 23-Aug 2-Sep  12-Sep 22-Sep
                                                             Date
                                         1E+05                                  4
                                         1E+04
                                         1E+03                                  3
                                         1E+02
                                       DNT total concentration (ng/g)  1E+00    2 Precipitation (cm/hr)
                                         1E+01
                                         1E–01
                                         1E–02
                                         1E–03
                                         1E–04
                                         1E–05
                                         1E–06
                                                                        0 to 2.5 cm
                                         1E–07
                                                                        2.5 to 5.0 cm
                                                                        Precip (cm/hr)
                                         1E–08                          Surface  1
                                         1E–09
                                         1E–10                                  0
                                           9-Jun  19-Jun  29-Jun  9-Jul  19-Jul  29-Jul  8-Aug
                                                            Date
                                         1E+05                                 4
                                         1E+04
                                         1E+03                                 3
                                       DNT total concentration (ng/g)  1E+00  Surfa ce  2  Precipitation (cm/hr)
                                         1E+02
                                         1E+01
                                         1E–01
                                         1E–02
                                         1E–03
                                         1E–04
                                                                       0 to 2.5 cm
                                         1E–05
                                         1E–06
                                                                       Precip (cm/hr)
                                         1E–07
                                         1E–08                         2.5 to 5.0 c m  1
                                         1E–09
                                         1E–10                                 0
                                            5-Mar 15-Mar 25-Mar 4-Apr 14-Apr 24-Apr 4-May 14-May 24-May
                                                            Date
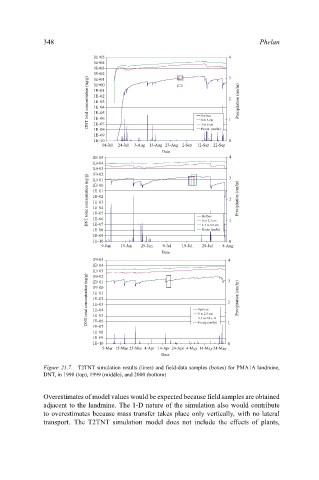
                           Figure 21.7. T2TNT simulation results (lines) and field-data samples (boxes) for PMA1A landmine,
                           DNT, in 1998 (top), 1999 (middle), and 2000 (bottom)
                           Overestimates of model values would be expected because field samples are obtained
                           adjacent to the landmine. The 1-D nature of the simulation also would contribute
                           to overestimates because mass transfer takes place only vertically, with no lateral
                           transport. The T2TNT simulation model does not include the effects of plants,
   342   343   344   345   346   347   348   349   350   351   352