Page 342 - gas transport in porous media
P. 342

Chapter 21: Gas Transport Issues in Landmine Detection
                               100
                               90                                 0.9 1                    343
                              Precipitation (cm/day) 80           Saturation  0.7
                                                                  0.8
                               70
                                                                  0.6
                               60
                                                                  0.5
                               50
                                                                  0.4
                               40
                               30
                               20                                 0.3    Bottom of mine
                                                                  0.2
                                                                          Top of mine
                               10                                 0.1     Surface
                                0                                  0
                                50  51  52  53  54  55  56  57  58  59  60  50  51  52  53  54  55  56  57  58  59  60
                                          Time (days)                         Time (days)
                              1200                                70
                              1000         Solar                  60          Surface
                                                                  50
                               800
                             Radiation (W/m 2 )  600  Long-Wave  Temperature (˚C)  40   Bottom of mine
                                                                  30
                               400
                                                                  20
                               200
                                                                               Top of mine
                               0                                  10
                                                 Ne t
                              –200                                 0
                                50  51  52  53  54  55  56  57  58  59  60  50  51  52  53  54  55  56  57  58  59  60
                                          Time (days)                         Time (days)
                                0
                               10                                 10 0
                                             DNT                  10 –2          DNT
                             Total concentration (ug/cm 3 )  10 –4 –6 –8  DNB  TNT  Solid-Phase concentration (ug/g-soil)  10 –4 –6 –8  DNB  TNT
                                –2
                              10
                                                                  10
                              10
                              10
                                                                  10
                              10
                                                                   –12
                               –12
                              10 –10                              10 –10
                                                                  10
                                50  51  52  53  54  55  56  57  58  59  60  50  51  52  53  54  55  56  57  58  59  60
                                          Time (days) DNT         10 –5 –7    Time (days)  DNT
                              Liquid-Phase concentration (ug/cm 3 -l)  10 –4 –6 –8  TNT  Gas-Phase concentration(ug/cm 3 -g) 10 –11 –9  DNB TNT
                                0
                               10
                                –2
                                                                  10
                              10
                                                                  10
                                                                   –13
                              10
                                                                  10
                                                    DNB
                                                                   –15
                              10
                                                                  10
                               –10
                              10
                                                                   –19
                                                                  10
                               –12
                              10
                                        53
                                            55
                                          54
                                     52
                                   51
                                50
                                                                             Time (days)
                                          Time (days) 56  57  58  59  60  10 –17 50  51  52  53  54  55  56  57  58  59  60
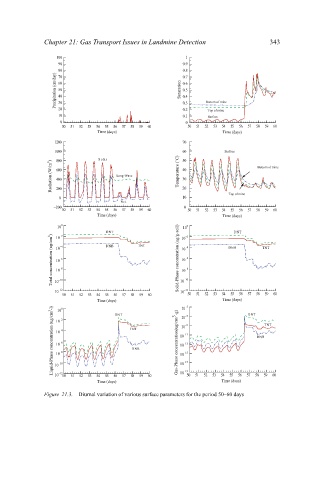
                           Figure 21.3.  Diurnal variation of various surface parameters for the period 50–60 days
   337   338   339   340   341   342   343   344   345   346   347