
Page 346 - gas transport in porous media
P. 346
Chapter 21: Gas Transport Issues in Landmine Detection
1E+1 3
1E+1 2 Surface 8 347
1E+1 1 0 to 2.5 cm 6
1E+1 0
2.5 to 5.0 cm
1E+0 9 Precip (cm/hr) 4 2
DNT total concentration (ng/g) 1E+0 5 0 –2 cm/hr) ( Precipitation
1E+0 8
1E+0 7
1E+0 6
1E+0 4
1E+0 3
1E+0 2
–4
1E+0 1
1E+0 0
–6
1E–01
1E–02
1E–03
1E–04 –8
–10
1E–05
1E–06 –12
1E–07
1E–08 –14
Jul-98 Oct-98 Jan-99 Apr-99 Jul-99 Oct-99 Jan-00 Apr-00 Jul-00
Date
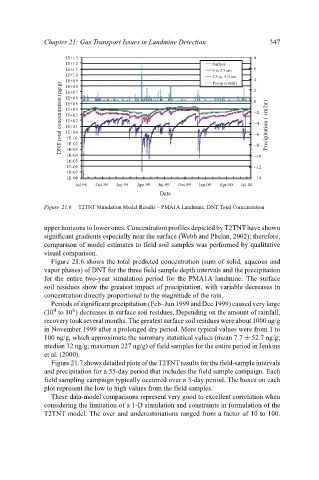
Figure 21.6. T2TNT Simulation Model Results – PMA1A Landmine, DNT Total Concentration
upper horizons to lower ones. Concentration profiles depicted by T2TNT have shown
significant gradients especially near the surface (Webb and Phelan, 2002); therefore,
comparison of model estimates to field soil samples was performed by qualitative
visual comparison.
Figure 21.6 shows the total predicted concentration (sum of solid, aqueous and
vapor phases) of DNT for the three field sample depth intervals and the precipitation
for the entire two-year simulation period for the PMA1A landmine. The surface
soil residues show the greatest impact of precipitation, with variable decreases in
concentration directly proportional to the magnitude of the rain.
Periods of significant precipitation (Feb–Jun 1999 and Dec 1999) caused very large
4
6
(10 to 10 ) decreases in surface soil residues. Depending on the amount of rainfall,
recovery took several months. The greatest surface soil residues were about 1000 ng/g
in November 1999 after a prolonged dry period. More typical values were from 1 to
100 ng/g, which approximate the summary statistical values (mean 7.7 ± 52.7 ng/g;
median 32 ng/g; maximum 227 ng/g) of field samples for the entire period in Jenkins
et al. (2000).
Figure 21.7 shows detailed plots of the T2TNT results for the field-sample intervals
and precipitation for a 55-day period that includes the field sample campaign. Each
field sampling campaign typically occurred over a 3-day period. The boxes on each
plot represent the low to high values from the field samples.
These data-model comparisons represent very good to excellent correlation when
considering the limitation of a 1-D simulation and constraints in formulation of the
T2TNT model. The over and underestimations ranged from a factor of 10 to 100.