
Page 344 - gas transport in porous media
P. 344
Chapter 21: Gas Transport Issues in Landmine Detection
1.00E+01 Kabul, Afghanistan 345
1.00E+00
1.00E–01
TNT Gas-phase concentration (ng/L) 1.00E–04
1.00E–02
1.00E–03
1.00E–05
1.00E–06
1.00E–07
1.00E–08
1.00E–09
1.00E–10
1.00E–11
1.00E–12
0 50 100 150 200 250 300 350
Time (days)
Ft. Leonard Wood, Missouri, USA
1.00E+01
1.00E+00
1.00E–01
TNT Gas-phase concentration (ng/L) 1.00E–03
1.00E–02
1.00E–04
1.00E–05
1.00E–06
1.00E–07
1.00E–08
1.00E–09
1.00E–10
1.00E–11
1.00E–12
0 50 100 150 200 250 300 350
Time (days)
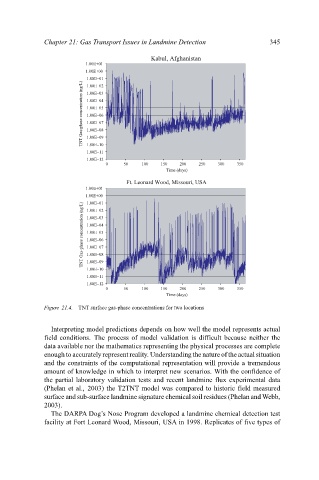
Figure 21.4. TNT surface gas-phase concentrations for two locations
Interpreting model predictions depends on how well the model represents actual
field conditions. The process of model validation is difficult because neither the
data available nor the mathematics representing the physical processes are complete
enough to accurately represent reality. Understanding the nature of the actual situation
and the constraints of the computational representation will provide a tremendous
amount of knowledge in which to interpret new scenarios. With the confidence of
the partial laboratory validation tests and recent landmine flux experimental data
(Phelan et al., 2003) the T2TNT model was compared to historic field measured
surface and sub-surface landmine signature chemical soil residues (Phelan and Webb,
2003).
The DARPA Dog’s Nose Program developed a landmine chemical detection test
facility at Fort Leonard Wood, Missouri, USA in 1998. Replicates of five types of