
Page 278 - Geochemical Anomaly and Mineral Prospectivity Mapping in GIS
P. 278
Data-Driven Modeling of Mineral Prospectivity 281
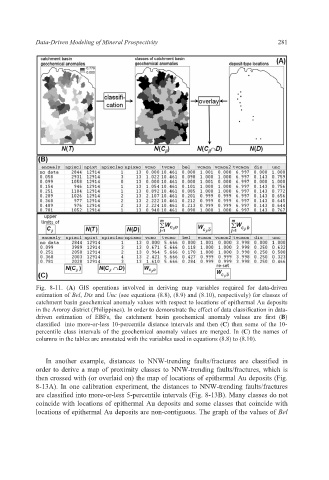
Fig. 8-11. (A) GIS operations involved in deriving map variables required for data-driven
estimation of Bel, Dis and Unc (see equations (8.8), (8.9) and (8.10), respectively) for classes of
catchment basin geochemical anomaly values with respect to locations of epithermal Au deposits
in the Aroroy district (Philippines). In order to demonstrate the effect of data classification in data-
driven estimation of EBFs, the catchment basin geochemical anomaly values are first (B)
classified into more-or-less 10-percentile distance intervals and then (C) then some of the 10-
percentile class intervals of the geochemical anomaly values are merged. In (C) the names of
columns in the tables are annotated with the variables used in equations (8.8) to (8.10).
In another example, distances to NNW-trending faults/fractures are classified in
order to derive a map of proximity classes to NNW-trending faults/fractures, which is
then crossed with (or overlaid on) the map of locations of epithermal Au deposits (Fig.
8-13A). In one calibration experiment, the distances to NNW-trending faults/fractures
are classified into more-or-less 5-percentile intervals (Fig. 8-13B). Many classes do not
coincide with locations of epithermal Au deposits and some classes that coincide with
locations of epithermal Au deposits are non-contiguous. The graph of the values of Bel