
Page 281 - Geochemical Anomaly and Mineral Prospectivity Mapping in GIS
P. 281
284 Chapter 8
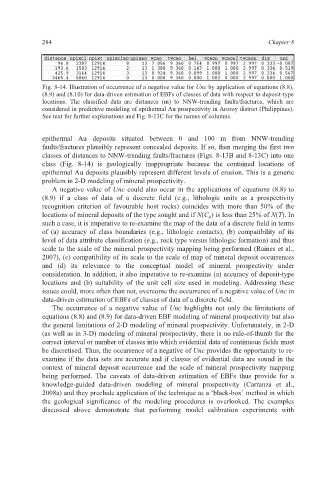
Fig. 8-14. Illustration of occurrence of a negative value for Unc by application of equations (8.8),
(8.9) and (8.10) for data-driven estimation of EBFs of classes of data with respect to deposit-type
locations. The classified data are distances (m) to NNW-trending faults/fractures, which are
considered in predictive modeling of epithermal Au prospectivity in Aroroy district (Philippines).
See text for further explanations and Fig. 8-13C for the names of columns.
epithermal Au deposits situated between 0 and 100 m from NNW-trending
faults/fractures plausibly represent concealed deposits. If so, then merging the first two
classes of distances to NNW-trending faults/fractures (Figs. 8-13B and 8-13C) into one
class (Fig. 8-14) is geologically inappropriate because the contained locations of
epithermal Au deposits plausibly represent different levels of erosion. This is a generic
problem in 2-D modeling of mineral prospectivity.
A negative value of Unc could also occur in the applications of equations (8.8) to
(8.9) if a class of data of a discrete field (e.g., lithologic units as a prospectivity
recognition criterion of favourable host rocks) coincides with more than 50% of the
locations of mineral deposits of the type sought and if N(C ji) is less than 25% of N(T). In
such a case, it is imperative to re-examine the map of the data of a discrete field in terms
of (a) accuracy of class boundaries (e.g., lithologic contacts), (b) compatibility of its
level of data attribute classification (e.g., rock type versus lithologic formation) and thus
scale to the scale of the mineral prospectivity mapping being performed (Raines et al.,
2007), (c) compatibility of its scale to the scale of map of mineral deposit occurrences
and (d) its relevance to the conceptual model of mineral prospectivity under
consideration. In addition, it also imperative to re-examine (a) accuracy of deposit-type
locations and (b) suitability of the unit cell size used in modeling. Addressing these
issues could, more often than not, overcome the occurrence of a negative value of Unc in
data-driven estimation of EBFs of classes of data of a discrete field.
The occurrence of a negative value of Unc highlights not only the limitations of
equations (8.8) and (8.9) for data-driven EBF modeling of mineral prospectivity but also
the general limitations of 2-D modeling of mineral prospectivity. Unfortunately, in 2-D
(as well as in 3-D) modeling of mineral prospectivity, there is no rule-of-thumb for the
correct interval or number of classes into which evidential data of continuous fields must
be discretised. Thus, the occurrence of a negative of Unc provides the opportunity to re-
examine if the data sets are accurate and if classes of evidential data are sound in the
context of mineral deposit occurrence and the scale of mineral prospectivity mapping
being performed. The caveats of data-driven estimation of EBFs thus provide for a
knowledge-guided data-driven modeling of mineral prospectivity (Carranza et al.,
2008a) and they preclude application of the technique as a ‘black-box’ method in which
the geological significance of the modeling procedures is overlooked. The examples
discussed above demonstrate that performing model calibration experiments with