
Page 286 - Geochemical Anomaly and Mineral Prospectivity Mapping in GIS
P. 286
Data-Driven Modeling of Mineral Prospectivity 289
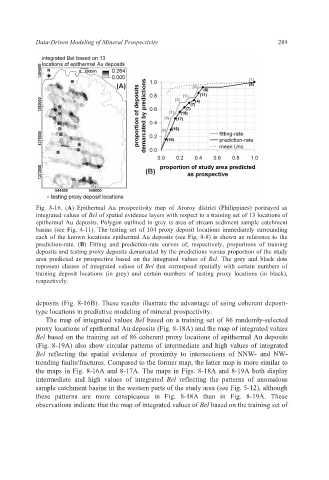
Fig. 8-16. (A) Epithermal Au prospectivity map of Aroroy district (Philippines) portrayed as
integrated values of Bel of spatial evidence layers with respect to a training set of 13 locations of
epithermal Au deposits. Polygon outlined in grey is area of stream sediment sample catchment
basins (see Fig. 4-11). The testing set of 104 proxy deposit locations immediately surrounding
each of the known locations epithermal Au deposits (see Fig. 8-8) is shown as reference to the
prediction-rate. (B) Fitting and prediction-rate curves of, respectively, proportions of training
deposits and testing proxy deposits demarcated by the predictions versus proportion of the study
area predicted as prospective based on the integrated values of Bel. The grey and black dots
represent classes of integrated values of Bel that correspond spatially with certain numbers of
training deposit locations (in grey) and certain numbers of testing proxy locations (in black),
respectively.
deposits (Fig. 8-16B). These results illustrate the advantage of using coherent deposit-
type locations in predictive modeling of mineral prospectivity.
The map of integrated values Bel based on a training set of 86 randomly-selected
proxy locations of epithermal Au deposits (Fig. 8-18A) and the map of integrated values
Bel based on the training set of 86 coherent proxy locations of epithermal Au deposits
(Fig. 8-19A) also show circular patterns of intermediate and high values of integrated
Bel reflecting the spatial evidence of proximity to intersections of NNW- and NW-
trending faults/fractures. Compared to the former map, the latter map is more similar to
the maps in Fig. 8-16A and 8-17A. The maps in Figs. 8-18A and 8-19A both display
intermediate and high values of integrated Bel reflecting the patterns of anomalous
sample catchment basins in the western parts of the study area (see Fig. 5-12), although
these patterns are more conspicuous in Fig. 8-18A than in Fig. 8-19A. These
observations indicate that the map of integrated values of Bel based on the training set of