
Page 287 - Geochemical Anomaly and Mineral Prospectivity Mapping in GIS
P. 287
290 Chapter 8
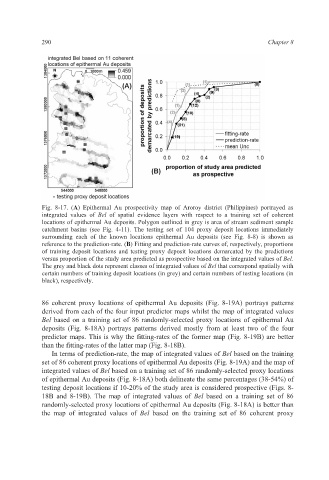
Fig. 8-17. (A) Epithermal Au prospectivity map of Aroroy district (Philippines) portrayed as
integrated values of Bel of spatial evidence layers with respect to a training set of coherent
locations of epithermal Au deposits. Polygon outlined in grey is area of stream sediment sample
catchment basins (see Fig. 4-11). The testing set of 104 proxy deposit locations immediately
surrounding each of the known locations epithermal Au deposits (see Fig. 8-8) is shown as
reference to the prediction-rate. (B) Fitting and prediction-rate curves of, respectively, proportions
of training deposit locations and testing proxy deposit locations demarcated by the predictions
versus proportion of the study area predicted as prospective based on the integrated values of Bel.
The grey and black dots represent classes of integrated values of Bel that correspond spatially with
certain numbers of training deposit locations (in grey) and certain numbers of testing locations (in
black), respectively.
86 coherent proxy locations of epithermal Au deposits (Fig. 8-19A) portrays patterns
derived from each of the four input predictor maps whilst the map of integrated values
Bel based on a training set of 86 randomly-selected proxy locations of epithermal Au
deposits (Fig. 8-18A) portrays patterns derived mostly from at least two of the four
predictor maps. This is why the fitting-rates of the former map (Fig. 8-19B) are better
than the fitting-rates of the latter map (Fig. 8-18B).
In terms of prediction-rate, the map of integrated values of Bel based on the training
set of 86 coherent proxy locations of epithermal Au deposits (Fig. 8-19A) and the map of
integrated values of Bel based on a training set of 86 randomly-selected proxy locations
of epithermal Au deposits (Fig. 8-18A) both delineate the same percentages (38-54%) of
testing deposit locations if 10-20% of the study area is considered prospective (Figs. 8-
18B and 8-19B). The map of integrated values of Bel based on a training set of 86
randomly-selected proxy locations of epithermal Au deposits (Fig. 8-18A) is better than
the map of integrated values of Bel based on the training set of 86 coherent proxy