
Page 285 - Geochemical Anomaly and Mineral Prospectivity Mapping in GIS
P. 285
288 Chapter 8
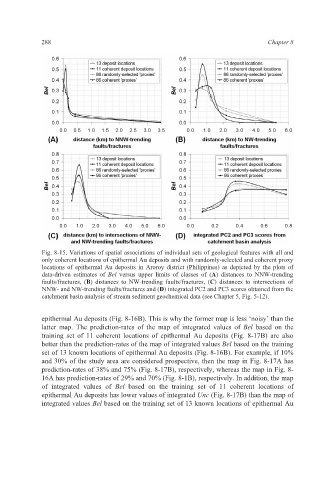
Fig. 8-15. Variations of spatial associations of individual sets of geological features with all and
only coherent locations of epithermal Au deposits and with randomly-selected and coherent proxy
locations of epithermal Au deposits in Aroroy district (Philippines) as depicted by the plots of
data-driven estimates of Bel versus upper limits of classes of (A) distances to NNW-trending
faults/fractures, (B) distances to NW-trending faults/fractures, (C) distances to intersections of
NNW- and NW-trending faults/fractures and (D) integrated PC2 and PC3 scores obtained from the
catchment basin analysis of stream sediment geochemical data (see Chapter 5, Fig. 5-12).
epithermal Au deposits (Fig. 8-16B). This is why the former map is less ‘noisy’ than the
latter map. The prediction-rates of the map of integrated values of Bel based on the
training set of 11 coherent locations of epithermal Au deposits (Fig. 8-17B) are also
better than the prediction-rates of the map of integrated values Bel based on the training
set of 13 known locations of epithermal Au deposits (Fig. 8-16B). For example, if 10%
and 30% of the study area are considered prospective, then the map in Fig. 8-17A has
prediction-rates of 38% and 75% (Fig. 8-17B), respectively, whereas the map in Fig. 8-
16A has prediction-rates of 29% and 70% (Fig. 8-1B), respectively. In addition, the map
of integrated values of Bel based on the training set of 11 coherent locations of
epithermal Au deposits has lower values of integrated Unc (Fig. 8-17B) than the map of
integrated values Bel based on the training set of 13 known locations of epithermal Au