
Page 288 - Geochemical Anomaly and Mineral Prospectivity Mapping in GIS
P. 288
Data-Driven Modeling of Mineral Prospectivity 291
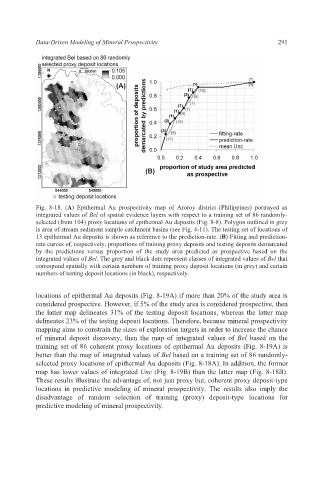
Fig. 8-18. (A) Epithermal Au prospectivity map of Aroroy district (Philippines) portrayed as
integrated values of Bel of spatial evidence layers with respect to a training set of 86 randomly-
selected (from 104) proxy locations of epithermal Au deposits (Fig. 8-8). Polygon outlined in grey
is area of stream sediment sample catchment basins (see Fig. 4-11). The testing set of locations of
13 epithermal Au deposits is shown as reference to the prediction-rate. (B) Fitting and prediction-
rate curves of, respectively, proportions of training proxy deposits and testing deposits demarcated
by the predictions versus proportion of the study area predicted as prospective based on the
integrated values of Bel. The grey and black dots represent classes of integrated values of Bel that
correspond spatially with certain numbers of training proxy deposit locations (in grey) and certain
numbers of testing deposit locations (in black), respectively.
locations of epithermal Au deposits (Fig. 8-19A) if more than 20% of the study area is
considered prospective. However, if 5% of the study area is considered prospective, then
the latter map delineates 31% of the testing deposit locations, whereas the latter map
delineates 23% of the testing deposit locations. Therefore, because mineral prospectivity
mapping aims to constrain the sizes of exploration targets in order to increase the chance
of mineral deposit discovery, then the map of integrated values of Bel based on the
training set of 86 coherent proxy locations of epithermal Au deposits (Fig. 8-19A) is
better than the map of integrated values of Bel based on a training set of 86 randomly-
selected proxy locations of epithermal Au deposits (Fig. 8-18A). In addition, the former
map has lower values of integrated Unc (Fig. 8-19B) than the latter map (Fig. 8-18B).
These results illustrate the advantage of, not just proxy but, coherent proxy deposit-type
locations in predictive modeling of mineral prospectivity. The results also imply the
disadvantage of random selection of training (proxy) deposit-type locations for
predictive modeling of mineral prospectivity.