
Page 289 - Geochemical Anomaly and Mineral Prospectivity Mapping in GIS
P. 289
292 Chapter 8
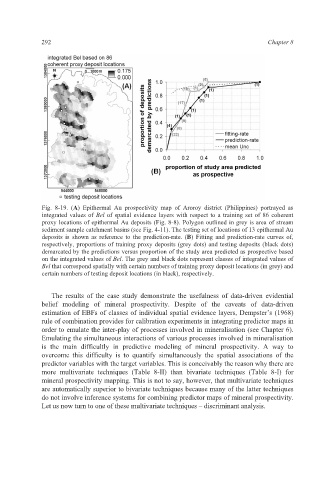
Fig. 8-19. (A) Epithermal Au prospectivity map of Aroroy district (Philippines) portrayed as
integrated values of Bel of spatial evidence layers with respect to a training set of 86 coherent
proxy locations of epithermal Au deposits (Fig. 8-8). Polygon outlined in grey is area of stream
sediment sample catchment basins (see Fig. 4-11). The testing set of locations of 13 epithermal Au
deposits is shown as reference to the prediction-rate. (B) Fitting and prediction-rate curves of,
respectively, proportions of training proxy deposits (grey dots) and testing deposits (black dots)
demarcated by the predictions versus proportion of the study area predicted as prospective based
on the integrated values of Bel. The grey and black dots represent classes of integrated values of
Bel that correspond spatially with certain numbers of training proxy deposit locations (in grey) and
certain numbers of testing deposit locations (in black), respectively.
The results of the case study demonstrate the usefulness of data-driven evidential
belief modeling of mineral prospectivity. Despite of the caveats of data-driven
estimation of EBFs of classes of individual spatial evidence layers, Dempster’s (1968)
rule of combination provides for calibration experiments in integrating predictor maps in
order to emulate the inter-play of processes involved in mineralisation (see Chapter 6).
Emulating the simultaneous interactions of various processes involved in mineralisation
is the main difficultly in predictive modeling of mineral prospectivity. A way to
overcome this difficulty is to quantify simultaneously the spatial associations of the
predictor variables with the target variables. This is conceivably the reason why there are
more multivariate techniques (Table 8-II) than bivariate techniques (Table 8-I) for
mineral prospectivity mapping. This is not to say, however, that multivariate techniques
are automatically superior to bivariate techniques because many of the latter techniques
do not involve inference systems for combining predictor maps of mineral prospectivity.
Let us now turn to one of these multivariate techniques – discriminant analysis.