
Page 284 - Geochemical Anomaly and Mineral Prospectivity Mapping in GIS
P. 284
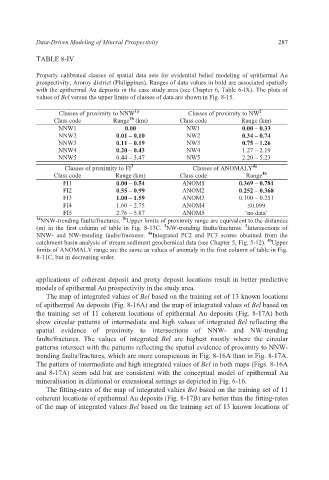
Data-Driven Modeling of Mineral Prospectivity                        287

           TABLE 8-IV

           Properly calibrated classes of spatial data sets  for evidential belief modeling  of epithermal Au
           prospectivity, Aroroy district (Philippines). Ranges of data values in bold are associated spatially
           with the epithermal Au deposits in the case study area (see Chapter 6, Table 6-IX). The plots of
           values of Bel versus the upper limits of classes of data are shown in Fig. 8-15.

                                                                           2
                                       1a
                  Classes of proximity to NNW         Classes of proximity to NW
                                      1b
                Class code       Range  (km)        Class code       Range (km)
                  NNW1              0.00              NW1             0.00 – 0.33
                  NNW2            0.01 – 0.10         NW2             0.34 – 0.74
                  NNW3            0.11 – 0.19         NW3             0.75 – 1.26
                  NNW4            0.20 – 0.43         NW4             1.27 – 2.19
                  NNW5            0.44 – 3.47         NW5             2.20 – 5.23
                                                                         4a
                                      3
                   Classes of proximity to FI           Classes of ANOMALY
                                                                           4b
                Class code        Range (km)        Class code         Range
                   FI1            0.00 – 0.54        ANOM1           0.369 – 0.781
                   FI2            0.55 – 0.99        ANOM2           0.252 – 0.368
                   FI3            1.00 – 1.59        ANOM3           0.100 – 0.251
                   FI4            1.60 – 2.75        ANOM4             ≤0.099
                   FI5            2.76 – 5.87        ANOM5             ‘no data’
           1a NNW-trending faults/fractures.  Upper limits of proximity range are equivalent to the distances
                                    1b
                                                                       3
                                                2
           (m) in the first column of table in Fig. 8-13C.  NW-trending faults/fractures.  Intersections of
                                           4a
           NNW- and  NW-trending faults/fractures.  Integrated PC2 and PC3 scores obtained from the
                                                                             4b
           catchment basin analysis of stream sediment geochemical data (see Chapter 5, Fig. 5-12).  Upper
           limits of ANOMALY range are the same as values of anomaly in the first column of table in Fig.
           8-11C, but in decreasing order.
           applications of coherent deposit and proxy deposit locations result in better predictive
           models of epithermal Au prospectivity in the study area.
              The map of integrated values of Bel based on the training set of 13 known locations
           of epithermal Au deposits (Fig. 8-16A) and the map of integrated values of Bel based on
           the training set of 11 coherent locations of epithermal Au deposits (Fig. 8-17A) both
           show circular patterns of intermediate and high values of integrated Bel reflecting the
           spatial evidence  of proximity to intersections  of NNW- and NW-trending
           faults/fractures.  The values of  integrated  Bel are  highest mostly where the circular
           patterns intersect with the patterns reflecting the spatial evidence of proximity to NNW-
           trending faults/fractures, which are more conspicuous in Fig. 8-16A than in Fig. 8-17A.
           The pattern of intermediate and high integrated values of Bel in both maps (Figs. 8-16A
           and 8-17A) seem odd but are consistent with the conceptual  model of epithermal Au
           mineralisation in dilational or extensional settings as depicted in Fig. 6-16.
              The fitting-rates of the map of integrated values Bel based on the training set of 11
           coherent locations of epithermal Au deposits (Fig. 8-17B) are better than the fitting-rates
           of the map of integrated values Bel based on the training set of 13 known locations of