
Page 279 - Geochemical Anomaly and Mineral Prospectivity Mapping in GIS
P. 279
282 Chapter 8
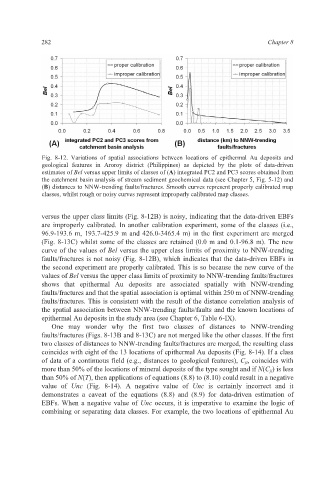
Fig. 8-12. Variations of spatial associations between locations of epithermal Au deposits and
geological features in Aroroy district (Philippines) as depicted by the plots of data-driven
estimates of Bel versus upper limits of classes of (A) integrated PC2 and PC3 scores obtained from
the catchment basin analysis of stream sediment geochemical data (see Chapter 5, Fig. 5-12) and
(B) distances to NNW-trending faults/fractures. Smooth curves represent properly calibrated map
classes, whilst rough or noisy curves represent improperly calibrated map classes.
versus the upper class limits (Fig. 8-12B) is noisy, indicating that the data-driven EBFs
are improperly calibrated. In another calibration experiment, some of the classes (i.e.,
96.9-193.6 m, 193.7-425.9 m and 426.0-3465.4 m) in the first experiment are merged
(Fig. 8-13C) whilst some of the classes are retained (0.0 m and 0.1-96.8 m). The new
curve of the values of Bel versus the upper class limits of proximity to NNW-trending
faults/fractures is not noisy (Fig. 8-12B), which indicates that the data-driven EBFs in
the second experiment are properly calibrated. This is so because the new curve of the
values of Bel versus the upper class limits of proximity to NNW-trending faults/fractures
shows that epithermal Au deposits are associated spatially with NNW-trending
faults/fractures and that the spatial association is optimal within 250 m of NNW-trending
faults/fractures. This is consistent with the result of the distance correlation analysis of
the spatial association between NNW-trending faults/faults and the known locations of
epithermal Au deposits in the study area (see Chapter 6, Table 6-IX).
One may wonder why the first two classes of distances to NNW-trending
faults/fractures (Figs. 8-13B and 8-13C) are not merged like the other classes. If the first
two classes of distances to NNW-trending faults/fractures are merged, the resulting class
coincides with eight of the 13 locations of epithermal Au deposits (Fig. 8-14). If a class
of data of a continuous field (e.g., distances to geological features), C ji, coincides with
more than 50% of the locations of mineral deposits of the type sought and if N(C ji) is less
than 50% of N(T), then applications of equations (8.8) to (8.10) could result in a negative
value of Unc (Fig. 8-14). A negative value of Unc is certainly incorrect and it
demonstrates a caveat of the equations (8.8) and (8.9) for data-driven estimation of
EBFs. When a negative value of Unc occurs, it is imperative to examine the logic of
combining or separating data classes. For example, the two locations of epithermal Au