
Page 280 - Geochemical Anomaly and Mineral Prospectivity Mapping in GIS
P. 280
Data-Driven Modeling of Mineral Prospectivity 283
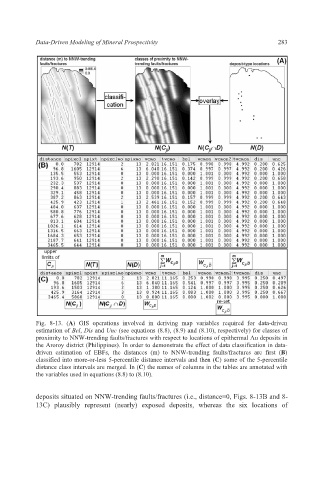
Fig. 8-13. (A) GIS operations involved in deriving map variables required for data-driven
estimation of Bel, Dis and Unc (see equations (8.8), (8.9) and (8.10), respectively) for classes of
proximity to NNW-trending faults/fractures with respect to locations of epithermal Au deposits in
the Aroroy district (Philippines). In order to demonstrate the effect of data classification in data-
driven estimation of EBFs, the distances (m) to NNW-trending faults/fractures are first (B)
classified into more-or-less 5-percentile distance intervals and then (C) some of the 5-percentile
distance class intervals are merged. In (C) the names of columns in the tables are annotated with
the variables used in equations (8.8) to (8.10).
deposits situated on NNW-trending faults/fractures (i.e., distance=0, Figs. 8-13B and 8-
13C) plausibly represent (nearly) exposed deposits, whereas the six locations of