
Page 298 - Geochemical Anomaly and Mineral Prospectivity Mapping in GIS
P. 298
Data-Driven Modeling of Mineral Prospectivity 301
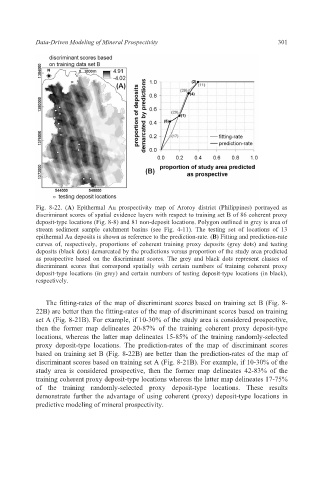
Fig. 8-22. (A) Epithermal Au prospectivity map of Aroroy district (Philippines) portrayed as
discriminant scores of spatial evidence layers with respect to training set B of 86 coherent proxy
deposit-type locations (Fig. 8-8) and 81 non-deposit locations. Polygon outlined in grey is area of
stream sediment sample catchment basins (see Fig. 4-11). The testing set of locations of 13
epithermal Au deposits is shown as reference to the prediction-rate. (B) Fitting and prediction-rate
curves of, respectively, proportions of coherent training proxy deposits (grey dots) and testing
deposits (black dots) demarcated by the predictions versus proportion of the study area predicted
as prospective based on the discriminant scores. The grey and black dots represent classes of
discriminant scores that correspond spatially with certain numbers of training coherent proxy
deposit-type locations (in grey) and certain numbers of testing deposit-type locations (in black),
respectively.
The fitting-rates of the map of discriminant scores based on training set B (Fig. 8-
22B) are better than the fitting-rates of the map of discriminant scores based on training
set A (Fig. 8-21B). For example, if 10-30% of the study area is considered prospective,
then the former map delineates 20-87% of the training coherent proxy deposit-type
locations, whereas the latter map delineates 15-85% of the training randomly-selected
proxy deposit-type locations. The prediction-rates of the map of discriminant scores
based on training set B (Fig. 8-22B) are better than the prediction-rates of the map of
discriminant scores based on training set A (Fig. 8-21B). For example, if 10-30% of the
study area is considered prospective, then the former map delineates 42-83% of the
training coherent proxy deposit-type locations whereas the latter map delineates 17-75%
of the training randomly-selected proxy deposit-type locations. These results
demonstrate further the advantage of using coherent (proxy) deposit-type locations in
predictive modeling of mineral prospectivity.