
Page 301 - Geochemical Anomaly and Mineral Prospectivity Mapping in GIS
P. 301
304 Chapter 8
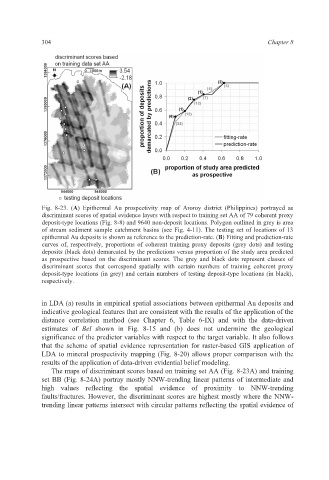
Fig. 8-23. (A) Epithermal Au prospectivity map of Aroroy district (Philippines) portrayed as
discriminant scores of spatial evidence layers with respect to training set AA of 79 coherent proxy
deposit-type locations (Fig. 8-8) and 9640 non-deposit locations. Polygon outlined in grey is area
of stream sediment sample catchment basins (see Fig. 4-11). The testing set of locations of 13
epithermal Au deposits is shown as reference to the prediction-rate. (B) Fitting and prediction-rate
curves of, respectively, proportions of coherent training proxy deposits (grey dots) and testing
deposits (black dots) demarcated by the predictions versus proportion of the study area predicted
as prospective based on the discriminant scores. The grey and black dots represent classes of
discriminant scores that correspond spatially with certain numbers of training coherent proxy
deposit-type locations (in grey) and certain numbers of testing deposit-type locations (in black),
respectively.
in LDA (a) results in empirical spatial associations between epithermal Au deposits and
indicative geological features that are consistent with the results of the application of the
distance correlation method (see Chapter 6, Table 6-IX) and with the data-driven
estimates of Bel shown in Fig. 8-15 and (b) does not undermine the geological
significance of the predictor variables with respect to the target variable. It also follows
that the scheme of spatial evidence representation for raster-based GIS application of
LDA to mineral prospectivity mapping (Fig. 8-20) allows proper comparison with the
results of the application of data-driven evidential belief modeling.
The maps of discriminant scores based on training set AA (Fig. 8-23A) and training
set BB (Fig. 8-24A) portray mostly NNW-trending linear patterns of intermediate and
high values reflecting the spatial evidence of proximity to NNW-trending
faults/fractures. However, the discriminant scores are highest mostly where the NNW-
trending linear patterns intersect with circular patterns reflecting the spatial evidence of