
Page 300 - Geochemical Anomaly and Mineral Prospectivity Mapping in GIS
P. 300
Data-Driven Modeling of Mineral Prospectivity 303
TABLE 8-VI
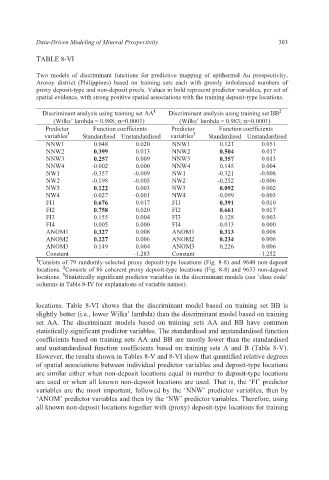
Two models of discriminant functions for predictive mapping of epithermal Au prospectivity,
Aroroy district (Philippines) based on training sets each with grossly imbalanced numbers of
proxy deposit-type and non-deposit pixels. Values in bold represent predictor variables, per set of
spatial evidence, with strong positive spatial associations with the training deposit-type locations.
Discriminant analysis using training set AA 1 Discriminant analysis using training set BB 2
(Wilks’ lambda = 0.988; α=0.0001) (Wilks’ lambda = 0.983; α=0.0001)
Predictor Function coefficients Predictor Function coefficients
3
3
variables Standardised Unstandardised variables Standardised Unstandardised
NNW1 0.048 0.020 NNW1 0.121 0.051
NNW2 0.399 0.013 NNW2 0.504 0.017
NNW3 0.257 0.009 NNW3 0.357 0.013
NNW4 -0.002 0.000 NNW4 0.145 0.004
NW1 -0.357 -0.009 NW1 -0.321 -0.008
NW2 -0.198 -0.005 NW2 -0.252 -0.006
NW3 0.122 0.003 NW3 0.092 0.002
NW4 -0.027 -0.001 NW4 -0.099 -0.003
FI1 0.676 0.017 FI1 0.391 0.010
FI2 0.758 0.020 FI2 0.661 0.017
FI3 0.155 0.004 FI3 0.128 0.003
FI4 0.005 0.000 FI4 -0.013 0.000
ANOM1 0.327 0.008 ANOM1 0.313 0.008
ANOM2 0.227 0.006 ANOM2 0.234 0.006
ANOM3 0.149 0.004 ANOM3 0.226 0.006
Constant - -1.283 Constant -1.252
1 Consists of 79 randomly-selected proxy deposit-type locations (Fig. 8-8) and 9640 non-deposit
2
locations. Consists of 86 coherent proxy deposit-type locations (Fig. 8-8) and 9633 non-deposit
3
locations. Statistically significant predictor variables in the discriminant models (see ‘class code’
columns in Table 8-IV for explanations of variable names).
locations. Table 8-VI shows that the discriminant model based on training set BB is
slightly better (i.e., lower Wilks’ lambda) than the discriminant model based on training
set AA. The discriminant models based on training sets AA and BB have common
statistically significant predictor variables. The standardised and unstandardised function
coefficients based on training sets AA and BB are mostly lower than the standardised
and unstandardised function coefficients based on training sets A and B (Table 8-V).
However, the results shown in Tables 8-V and 8-VI show that quantified relative degrees
of spatial associations between individual predictor variables and deposit-type locations
are similar either when non-deposit locations equal in number to deposit-type locations
are used or when all known non-deposit locations are used. That is, the ‘FI’ predictor
variables are the most important, followed by the ‘NNW’ predictor variables, then by
‘ANOM’ predictor variables and then by the ‘NW’ predictor variables. Therefore, using
all known non-deposit locations together with (proxy) deposit-type locations for training