
Page 297 - Geochemical Anomaly and Mineral Prospectivity Mapping in GIS
P. 297
300 Chapter 8
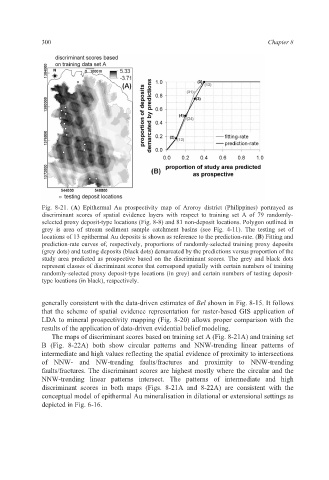
Fig. 8-21. (A) Epithermal Au prospectivity map of Aroroy district (Philippines) portrayed as
discriminant scores of spatial evidence layers with respect to training set A of 79 randomly-
selected proxy deposit-type locations (Fig. 8-8) and 81 non-deposit locations. Polygon outlined in
grey is area of stream sediment sample catchment basins (see Fig. 4-11). The testing set of
locations of 13 epithermal Au deposits is shown as reference to the prediction-rate. (B) Fitting and
prediction-rate curves of, respectively, proportions of randomly-selected training proxy deposits
(grey dots) and testing deposits (black dots) demarcated by the predictions versus proportion of the
study area predicted as prospective based on the discriminant scores. The grey and black dots
represent classes of discriminant scores that correspond spatially with certain numbers of training
randomly-selected proxy deposit-type locations (in grey) and certain numbers of testing deposit-
type locations (in black), respectively.
generally consistent with the data-driven estimates of Bel shown in Fig. 8-15. It follows
that the scheme of spatial evidence representation for raster-based GIS application of
LDA to mineral prospectivity mapping (Fig. 8-20) allows proper comparison with the
results of the application of data-driven evidential belief modeling.
The maps of discriminant scores based on training set A (Fig. 8-21A) and training set
B (Fig. 8-22A) both show circular patterns and NNW-trending linear patterns of
intermediate and high values reflecting the spatial evidence of proximity to intersections
of NNW- and NW-trending faults/fractures and proximity to NNW-trending
faults/fractures. The discriminant scores are highest mostly where the circular and the
NNW-trending linear patterns intersect. The patterns of intermediate and high
discriminant scores in both maps (Figs. 8-21A and 8-22A) are consistent with the
conceptual model of epithermal Au mineralisation in dilational or extensional settings as
depicted in Fig. 6-16.