
Page 302 - Geochemical Anomaly and Mineral Prospectivity Mapping in GIS
P. 302
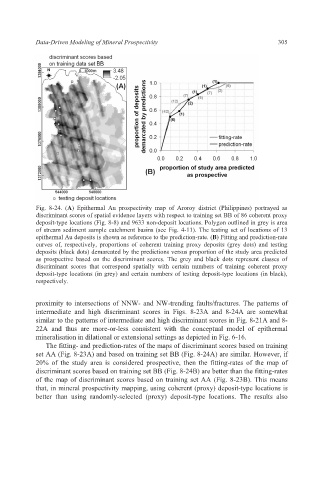
Data-Driven Modeling of Mineral Prospectivity                        305


           Fig. 8-24. (A) Epithermal Au prospectivity map of Aroroy district (Philippines) portrayed as
           discriminant scores of spatial evidence layers with respect to training set BB of 86 coherent proxy
           deposit-type locations (Fig. 8-8) and 9633 non-deposit locations. Polygon outlined in grey is area
           of stream sediment sample catchment basins (see Fig. 4-11). The testing set of locations of 13
           epithermal Au deposits is shown as reference to the prediction-rate. (B) Fitting and prediction-rate
           curves of, respectively, proportions of coherent training proxy  deposits (grey  dots) and testing
           deposits (black dots) demarcated by the predictions versus proportion of the study area predicted
           as prospective based on the discriminant scores. The grey  and  black dots represent classes of
           discriminant scores that  correspond spatially with certain numbers of training  coherent proxy
           deposit-type locations (in grey) and certain numbers of testing deposit-type locations (in black),
           respectively.


           proximity to intersections of NNW- and NW-trending faults/fractures. The patterns of
           intermediate and  high discriminant scores in Figs.  8-23A and 8-24A are somewhat
           similar to the patterns of intermediate and high discriminant scores in Fig. 8-21A and 8-
           22A and thus are more-or-less consistent  with the conceptual model of epithermal
           mineralisation in dilational or extensional settings as depicted in Fig. 6-16.
              The fitting- and prediction-rates of the maps of discriminant scores based on training
           set AA (Fig. 8-23A) and based on training set BB (Fig. 8-24A) are similar. However, if
           20%  of the study area is considered prospective, then the fitting-rates  of the map  of
           discriminant scores based on training set BB (Fig. 8-24B) are better than the fitting-rates
           of the map of discriminant scores based on training set AA (Fig. 8-23B). This means
           that, in mineral prospectivity mapping, using coherent (proxy) deposit-type locations is
           better than using randomly-selected (proxy)  deposit-type locations. The results also