
Page 47 - Geochemical Anomaly and Mineral Prospectivity Mapping in GIS
P. 47
Spatial Data Models, Management and Operations 43
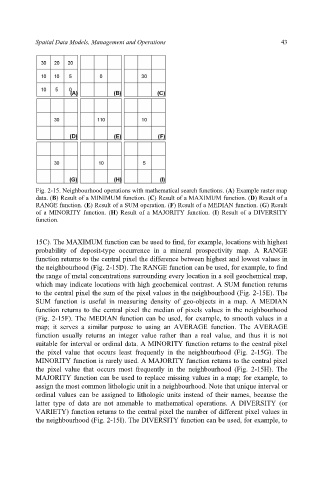
Fig. 2-15. Neighbourhood operations with mathematical search functions. (A) Example raster map
data. (B) Result of a MINIMUM function. (C) Result of a MAXIMUM function. (D) Result of a
RANGE function. (E) Result of a SUM operation. (F) Result of a MEDIAN function. (G) Result
of a MINORITY function. (H) Result of a MAJORITY function. (I) Result of a DIVERSITY
function.
15C). The MAXIMUM function can be used to find, for example, locations with highest
probability of deposit-type occurrence in a mineral prospectivity map. A RANGE
function returns to the central pixel the difference between highest and lowest values in
the neighbourhood (Fig. 2-15D). The RANGE function can be used, for example, to find
the range of metal concentrations surrounding every location in a soil geochemical map,
which may indicate locations with high geochemical contrast. A SUM function returns
to the central pixel the sum of the pixel values in the neighbourhood (Fig. 2-15E). The
SUM function is useful in measuring density of geo-objects in a map. A MEDIAN
function returns to the central pixel the median of pixels values in the neighbourhood
(Fig. 2-15F). The MEDIAN function can be used, for example, to smooth values in a
map; it serves a similar purpose to using an AVERAGE function. The AVERAGE
function usually returns an integer value rather than a real value, and thus it is not
suitable for interval or ordinal data. A MINORITY function returns to the central pixel
the pixel value that occurs least frequently in the neighbourhood (Fig. 2-15G). The
MINORITY function is rarely used. A MAJORITY function returns to the central pixel
the pixel value that occurs most frequently in the neighbourhood (Fig. 2-15H). The
MAJORITY function can be used to replace missing values in a map; for example, to
assign the most common lithologic unit in a neighbourhood. Note that unique interval or
ordinal values can be assigned to lithologic units instead of their names, because the
latter type of data are not amenable to mathematical operations. A DIVERSITY (or
VARIETY) function returns to the central pixel the number of different pixel values in
the neighbourhood (Fig. 2-15I). The DIVERSITY function can be used, for example, to