
Page 177 - Geochemical Remote Sensing of The Sub-Surface
P. 177
154 V.T. Jones, M.D. Matthews and D.M. Richers
PPM
10 6
..... / f " ~ T "--7- A \ , ,_ '1o:
....... '~ 10 3
"~ ~ ~ ' , ',,, _ ~o 2
~" .,. ~.. ~ - - .,nl
48O
[] 9 = =!@lllt.m [] r l
" ' ~I~ . . . . . . . . . 475
I ! " | H U | ~ . _ 47,o
.... 465
, ~ ~ -"" gllg_.~__iUg an..~. ,so
.
.t . . . . , ....agl illlH~ . 45s
.
:-- U u | [] . . . . . . . . ,, 450
. . . . . . . . . . 445
. . . . . . . . . . . . . . 440
ltl u
, ,, 435
, 430
425
Horizontal scale 20 ' Red-Brown
Vertical scale 5'
Green-Black
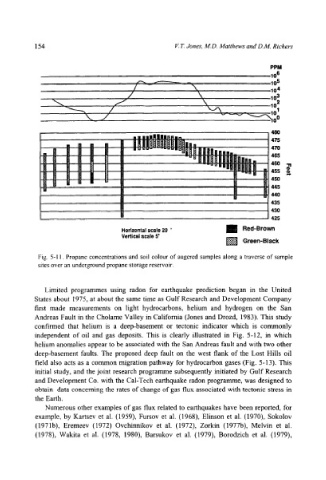
Fig. 5-1 I. Propane concentrations and soil colour of augered samples along a traverse of sample
sites over an underground propane storage reservoir.
Limited programmes using radon for earthquake prediction began in the United
States about 1975, at about the same time as Gulf Research and Development Company
first made measurements on light hydrocarbons, helium and hydrogen on the San
Andreas Fault in the Cholame Valley in Califomia (Jones and Drozd, 1983). This study
confirmed that helium is a deep-basement or tectonic indicator which is commonly
independent of oil and gas deposits. This is clearly illustrated in Fig. 5-12, in which
helium anomalies appear to be associated with the San Andreas fault and with two other
deep-basement faults. The proposed deep fault on the west flank of the Lost Hills oil
field also acts as a common migration pathway for hydrocarbon gases (Fig. 5-13). This
initial study, and the joint research programme subsequently initiated by Gulf Research
and Development Co. with the Cal-Tech earthquake radon programme, was designed to
obtain data concerning the rates of change of gas flux associated with tectonic stress in
the Earth.
Numerous other examples of gas flux related to earthquakes have been reported, for
example, by Kartsev et al. (1959), Fursov et al. (1968), Elinson et al. (1970), Sokolov
(1971b), Eremeev (1972) Ovchinnikov et al. (1972), Zorkin (1977b), Melvin et al.
(1978), Wakita et al. (1978, 1980), Barsukov et al. (1979), Borodzich et al. (1979),