
Page 175 - Geochemical Remote Sensing of The Sub-Surface
P. 175
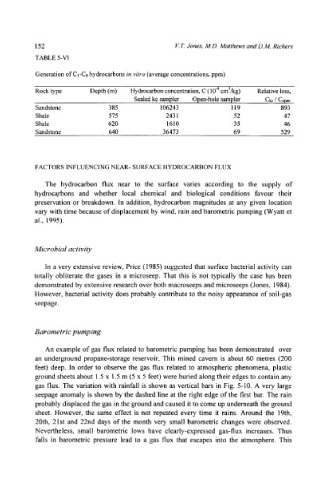
152                                     V.T. Jones,  M.D. Matthews and D.M. Richers
           TABLE 5-VI
           Generation of C1-C4 hydrocarbons in vitro (average concentrations, ppm)

           Rock type       Depth (m)   Hydrocarbon concentration, C (10 -4 cm3/kg)   Relative loss,
                                       Sealed kc sampler   Open-hole sampler   Ckr / Co~n
           Sandstone            385           106243              119           893
           Shale                575             2431               52            47
           Shale                620             1610               35            46
           Sandstone            640            36473               69           529


           FACTORS INFLUENCING NEAR- SURFACE HYDROCARBON FLUX

              The  hydrocarbon  flux  near  to  the  surface  varies  according  to  the  supply  of
           hydroca~rbons  and  whether  local  chemical  and  biological  conditions  favour  their
           preservation  or  breakdown.  In  addition,  hydrocarbon  magnitudes  at  any  given  location
           vary with time because of displacement by wind,  rain and barometric pumping (Wyatt et
           al.,  1995).


           Microbial  activity

              In a very extensive  review,  Price  (1985)  suggested that  surface  bacterial  activity  can
           totally  obliterate  the  gases  in  a  microseep.  That  this  is  not  typically  the  case  has  been
           demonstrated by extensive  research over both macroseeps and  microseeps (Jones,  1984).
           However,  bacterial  activity does probably contribute  to the  noisy appearance  of soil-gas
           seepage.


           Barometric  pumping

              An  example  of gas  flux  related  to  barometric  pumping  has  been  demonstrated  over
           an  underground  propane-storage  reservoir.  This  mined  cavern  is  about  60  metres  (200
           feet)  deep.  In  order  to  observe  the  gas  flux  related  to  atmospheric  phenomena,  plastic
           ground sheets about  1.5 x  1.5 m (5 x 5 feet) were buried  along their edges to contain  any
           gas  flux.  The  variation  with  rainfall  is shown  as  vertical  bars  in  Fig.  5-10.  A  very  large
           seepage  anomaly  is shown by the  dashed  line  at the  right edge  of the  first  bar.  The  rain
           probably displaced the gas in the ground and caused  it to come up underneath the ground
           sheet.  However,  the  same  effect  is  not  repeated  every  time  it  rains.  Around  the  19th,
           20th,  21st  and  22nd  days  of the  month  very  small  barometric  changes  were  observed.
           Nevertheless,  small  barometric  lows  have  clearly-expressed  gas-flux  increases.  Thus
           falls  in  barometric  pressure  lead  to  a  gas  flux  that  escapes  into  the  atmosphere.  This